Curated OER
Graph Functions with Integers
Fifth graders can do a quick review of graphing functions using integers with this worksheet. The worksheet has questions which require students to identify the pertinent information in a word problem, and create a graph to represent the...
Curated OER
Maps and Lines
In these organizing data worksheets, 5th graders complete four worksheets of activities that help them learn maps, graphs, and lines. Students then study images of maps, lines, and graphs.
Curated OER
Making A Horizontal Bar Graph
In this bar graph instructional activity, students create a bar graph to display 6 scores from basketball games. Students will label the x and y axis and correctly plot the scores from the table provided.
Curated OER
Life Expectancy at Birth
Students create a line graph on the life expectancy for males and females in Canada. In this math and health lesson plan, students review table and graph terminology, create line graphs, and analyze the differences in life expectancy...
Curated OER
Problem Solving: Graphing Functions
In this graphing functions activity, students solve 6 word problems, finding ordered pairs, missing coordinates and numbers, slopes of lines and functions.
Curated OER
Graph Lesson Plan
Fifth graders identify different types of graphs. In this graphing lesson plan, 5th graders record their favorite fast food restaurants and graph the results. A graph song to the tune of "Macarena" is included.
Curated OER
Make and Read Bar Graphs
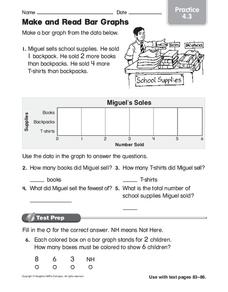
In this bar graphs worksheet, students make a bar graph about the sale of school supplies with the data presented in one story problem.
Curated OER
Line and Double Line Graphs: Reteach
In this graphing worksheet, students review the five steps for making a double line graph to display data. Students then use the graph they made following the shapes to answer the three questions.
Curated OER
Line and Double Line Graphs: Practice
In this graphing data instructional activity, students use the double line graph to answer the five questions about high and low temperatures. Students then complete two test prep questions.
Curated OER
Locate Points on a Grid: Practice
In this ordered pairs worksheet, students use the graph and write the letter of the point for each ordered pair. Students then write the ordered pair for the given points. Students then answer the six grid location questions.
Curated OER
Chance and Data
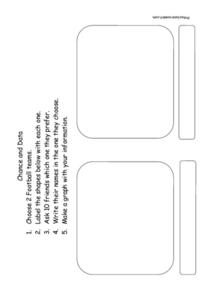
In this graphing a survey worksheet, learners poll 10 friends to see which of 2 football teams is their favorite and then graph their data results.
Curated OER
ACT Questions of the Day 5/21/08
In this ACT practice learning exercise, students solve the ACT question of the day in which they select the graph that represents the inequality equation. There are 5 graphs to choose from.
Curated OER
Topic 6.1 - Solving Quadratic Equations by Graphing
In this quadratic equation worksheet, students graph each quadratic equation, name the axis of symmetry, name the vertex, and identify the solutions of the equation. There are 12 problems on this page.
Curated OER
Topic 2.2 - Graphing Linear Equations
For this linear equation worksheet, students write 9 linear equations in Standard Form. They then find the x and y-intercept of the graph of each of 6 equations. Finally, students graph 6 equations on the blank graphs provided on the page.
Curated OER
Why Did the Plum Divorce the Grape? What Did the Boy Tree Say to the Girl Tree?
In this solving inequalities worksheet, students graph and shade 15 inequalities. Students then use their shading to help answer the two riddles.
Curated OER
Linear Inequalities
In this linear inequalities worksheet, students graph and shade 6 linear inequalities. Students then graph and shade 3 absolute value inequalities.
Curated OER
Sunshine Math - 3
In this math review worksheet, students answer 5 word problems involving patterns and algebraic reasoning. Students then answer 1 story problem about the perimeter of a triangle. Next, students examine a graph and answer a 4 part fill...
Curated OER
Pounds of Paper
For this collecting of data worksheet, 2nd graders study and analyze a pounds of paper table in order to solve and answer 6 mathematical questions.
Curated OER
Using Charts, Graphs, Tables, or Charts
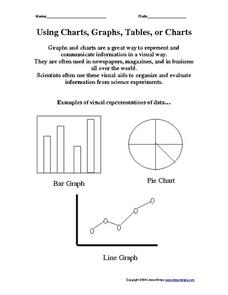
In this charts, graphs and tables activity, students view 3 different types of visual representations of data, make a list of 20 items and decide how the items can best be put together in groups to make a graph, chart or table. Students...
Curated OER
Graphing Inequalities in Two Variables
In this graphing inequalities worksheet, students shade 3 inequality problems. Students then graph and shade 4 additional inequalities.
Curated OER
Graphing Inequalities
In this graphing inequalities worksheet, learners complete 8 inequality tables. Students then graph and shade the 8 inequalities on a coordinate plane.
Curated OER
Equations: Graphs, Lines, Slope
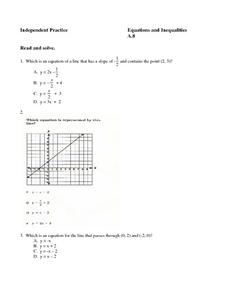
In this equations worksheet, students complete 8 multiple choice questions regarding writing equations in slope-intercept and matching an equation to its graph in the coordinate plane.
Curated OER
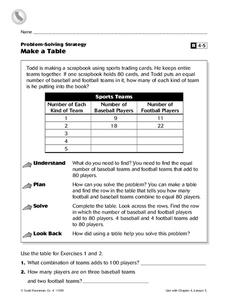
Make a Table
In this charting activity, 4th graders complete a table. Using the information provided, students fill in the missing data and complete 2 short answer questions.
Curated OER
Graphing Functions
In this graphing functions worksheet, 10th graders solve 10 different problems that illustrate various graphs of functions. They determine the type of function that each graph shows. Then, students write the equation for the line graphed...


