Curated OER
Properties of Parabolas
Have your learners investigate parabolas. In this Algebra II lesson, students explore the basic definition of a parabola by using Cabri Jr. to create a parabola given the focus and directrix. Students interpret the equation for a...
Curated OER
Algebra Nomograph
Investigation of a nomograph teaches young scholars to determine the rule of a function by examining the input and output values. Students use a nomograph on their Ti-Nspire to determine the function rule. Young scholars make a scatter...
Curated OER
Function Composition
High schoolers solve two functions at once. In this algebra lesson, students add, subtract, multiply and divide composition functions. They use the correct notation and substitution to get their answer.
Curated OER
Discovery Research of Quadratics
Students investigate the properties behind the quadratic equation. In this algebra lesson, students identify quadratic equation in the real world. They graph the parabola and identify the vertex and intercepts.
Curated OER
Who Shares My Function?
Young scholars differentiate between linear and quadratic functions. In this algebra lesson, students write equations of graphs and graph a function from an equation. They also move the graph around on the coordinate plane.
Curated OER
Model Data with Quadratic Functions
Young scholars model data using quadratic equations. In this algebra lesson plan, students simplify and factor quadratic equations. They graph the function using collected data and analyze the parabola.
Curated OER
The Kangaroo Conundrum: A Study of a Quadratic Function
Students play a game and collect data for their graph. In this algebra lesson, students solve quadratic equations and identify properties of their graph. They describe the pattern created by the graph and the game.
Curated OER
A Study of a Quadratic Function
Students factor and solve quadratic equations. In this algebra lesson, students play a game as the collect and graph data. they identify properties of their parabola and make predictions.
EngageNY
Modeling a Context from Data (part 1)
While creating models from data, pupils make decisions about precision. Exercises are provided that require linear, quadratic, or exponential models based upon the desired precision.
Point Pleasant Beach School District
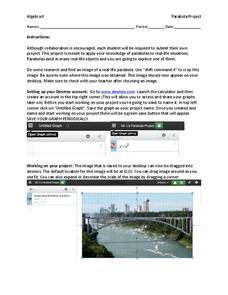
Parabola Project
Class members select a picture that contains a parabola and construct a drawing of it using function graphs in the quadratic project. Individuals restrict the domains of the functions to create a more accurate drawing. They then submit a...
Concord Consortium
In a Triangle
What's in a triangle? Just 180 degrees worth of angles! Young learners use given angle relationships in a triangle to write an algebraic representation. Using a system of equations, they simplify the equation to a linear representation.
Curated OER
Quadratic Functions
In this algebra instructional activity, students factor quadratic equations and graph their resulting parabola. They relate quadratics to real life scenario. There are 20 questions with an answer key.
Curated OER
Lesson 10-6: Using the Quadratic Formula
In this quadratic formula activity, students solve 5 quadratic problems. Students use the quadratic formula to find maximums, minimums, roots, and y-intercepts.
Curated OER
Transformations and Exponential Functions
Tenth graders study graphing exponential functions. In this transformations lesson, 10th graders apply inquiry to determine how changes to a parent function affect its graph. Students analyze transformed graphs and generate the function...
Curated OER
Math Regents Exam Questions: Graphing Rational Functions
In this graphing rational functions worksheet, students answer 18 multiple choice problems about rational functions. Students determine values for a which a function is undefined given the equation of the function.
Curated OER
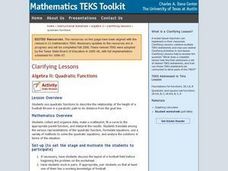
Algebra II: Quadratic Functions
Students collect and organize data, make a scatterplot, fit a curve to the appropriate parent function, and interpret the results. Students translate among the various representations of the quadratic function, formulate equations, use a...
EngageNY
Analyzing a Graph
Collaborative groups utilize their knowledge of parent functions and transformations to determine the equations associated with graphs. The graph is then related to the scenario it represents.
Curated OER
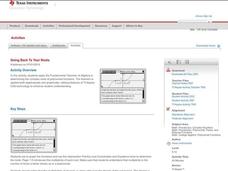
Going Back to Your Roots
Investigate the Fundamental Theorem of Algebra and explore polynomial equations to determine the number of factors, the number of roots, and investigate multiplicity of roots.
Kuta Software
Imaginary Numbers
Here is a worksheet that takes all aspects of quadratic functions and incorporates imaginary numbers into the problems. The problems range from simplifying to graphing and solving by using a variety of methods with imaginary and complex...
West Contra Costa Unified School District
Writing Exponential Functions Based on Data
Give your class a concrete example of exponential growth and decay using this hands-on activity. These Algebra II lessons allow for the exploration of exponential growth and decay models, as well as the discovery of the patterns of each....
West Contra Costa Unified School District
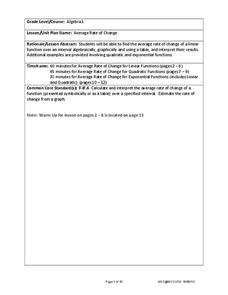
Average Rate of Change
Learners investigate average rates of change for linear functions and connect the concept to slope. They then determine average rates of change in quadratic and exponential functions.
Desmos
Desmos Graphing Calculator
They say a graph is worth a thousand points. The interactive allows users to graph a wide variety of functions and equations. Using the included keyboard or typing directly into the list, learners determine the graph of a function....
Curated OER
Vertex and Factored Form of Quadratic Functions
Students graph quadratic equations. In this algebra lesson plan, students solve quadratic equations by factoring. They identify the end behavior of the graph.
Curated OER
Finding the Vertex of a Quadratic Function
Students solve quadratic equations and identify the vertex. In this algebra lesson plan, students factor quadratic equations and identify the different properties of a parabola. They graph the functions using the vertex and intercepts.


