Texas Instruments
Texas Instruments: Transformations of Quadratics
Series of LearningCheck documents to assess student knowledge of quadratic transformations.
CK-12 Foundation
Ck 12: Algebra: Identification of Quadratic Models
[Free Registration/Login may be required to access all resource tools.] This lesson covers fitting a data set to a quadratic equation.
Wyzant
Wyzant: Function Graphing Calculator
Students input a function in either y= of f(x)= form, and then the site from WyzAnt does the rest! A detailed graph is shown in less than a second. Students can change the window used to view the graph as well as whether to have...
Khan Academy
Khan Academy: Graph Parabolas in All Forms
Graph quadratic functions given in any form.
Texas Education Agency
Texas Gateway: Quadratics: Connecting Roots, Zeros, and X Intercepts
Given a quadratic equation, the student will make connections among the solutions (roots) of the quadratic equation, the zeros of their related functions, and the horizontal intercepts (x-intercepts) of the graph of the function.
Integrated Publishing
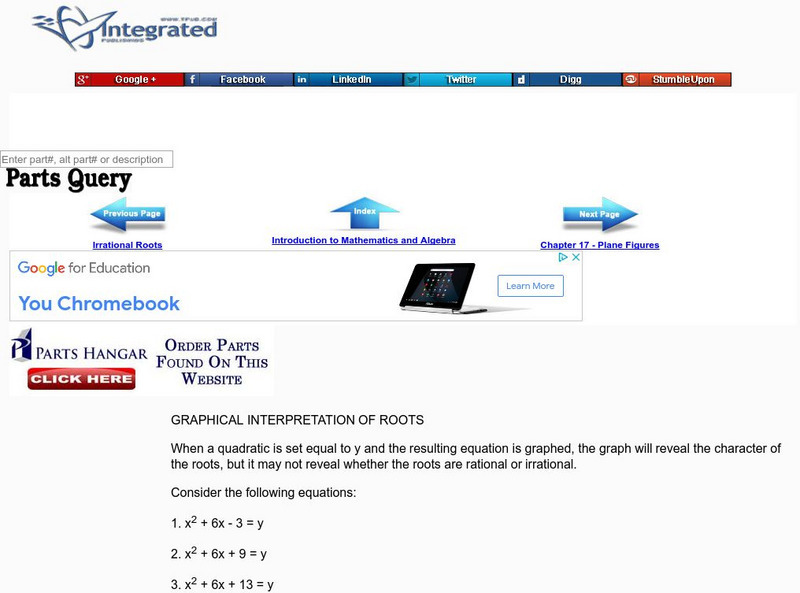
Integrated Publishing: Graphical Interpretation of Roots
This site compares the graphs of three quadratic functions, and explains how certain characteristics of the graph relate to properties of the equations and their solutions. Contains practice problems, including real-world examples.
Texas Instruments
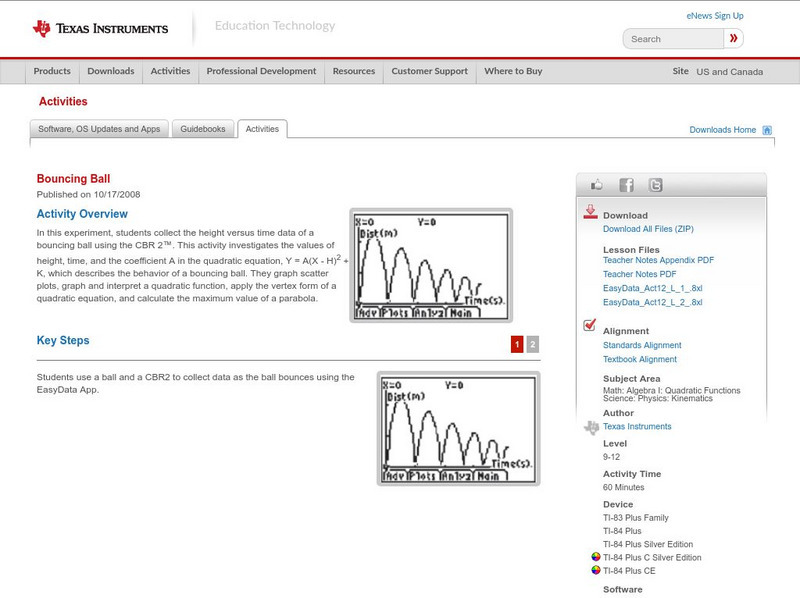
Texas Instruments: Bouncing Ball
In this experiment, students collect the height versus time data of a bouncing ball using the CBR 2. This activity investigates the values of height, time, and the coefficient A in the quadratic equation, which describes the behavior of...
Texas Instruments
Texas Instruments: Investigating the Parabola in Vertex Form (Y = Ax2
In this activity, students investigate the standard form of the quadratic function, y = ax^2 + bx + c. They investigate the changes on the graph of a quadratic equation that result from changes in A, B, and C. They also locate the vertex...
Texas Instruments
Texas Instruments: Floral Shop Math
Students will create quadratic functions that model revenue collected and profit earned from selling bouquets in a flower shop. The students can use graphing calculators to identify the maximum value for each function. Once they identify...
Texas Instruments
Texas Instruments: Playing With the Transformation Application
Students try to fit a quadratic function to the 200 m world record data using the transformation graphing application.
Illustrative Mathematics
Illustrative Mathematics: F Le Finding Parabolas Through Two Points
For this task, students are asked to find the quadratic functions that pass through two given points on a coordinate grid and to describe how their graphs are related. Aligns with F-LE.A.2.
Richland Community College
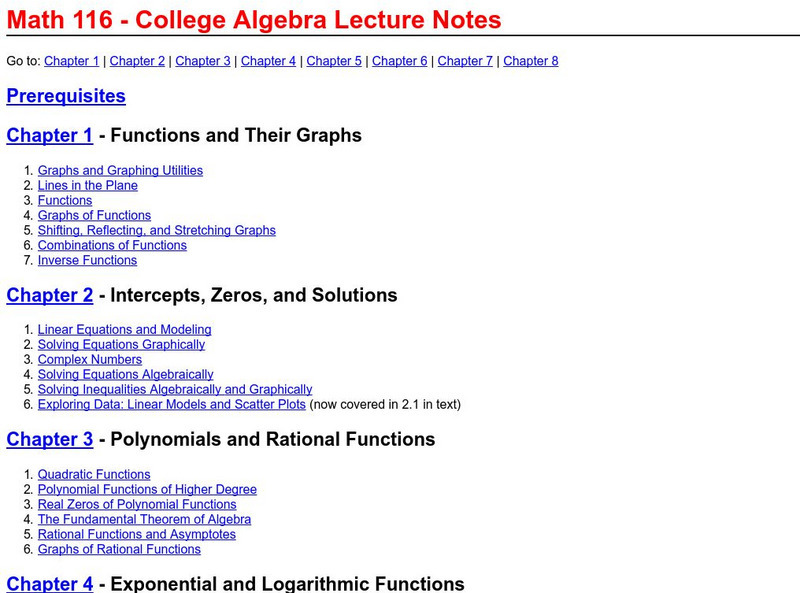
Richland Community College: Algebra Lecture Notes
This site from Richland Community College provides lecture notes to a class on Algebra. It covers a wide array of topics including functions, quadratic equations, inequalities, and much more.
Texas Instruments
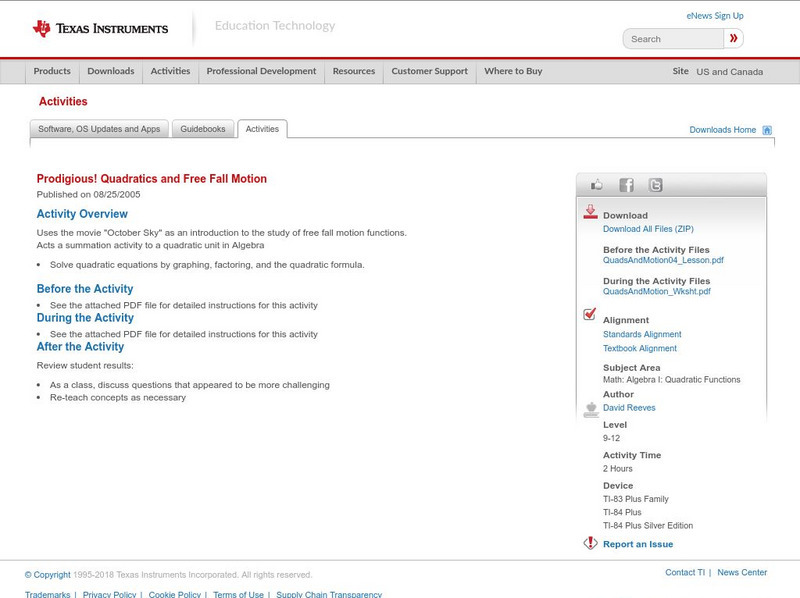
Texas Instruments: Prodigious! Quadratics and Free Fall Motion
Uses the movie "October Sky" as an introduction to the study of free fall motion functions. Acts a summation activity to a quadratic unit in Algebra. Solve quadratic equations by graphing, factoring, and the quadratic formula.
Texas Instruments
Texas Instruments: Exploring Families of Functions
This activity provides students an opportunity to discover the similarities involved in shifting the parent functions for absolute value, quadratic, cubic, radical, exponential, and logarithmic functions. Students will also be given the...
Illustrative Mathematics
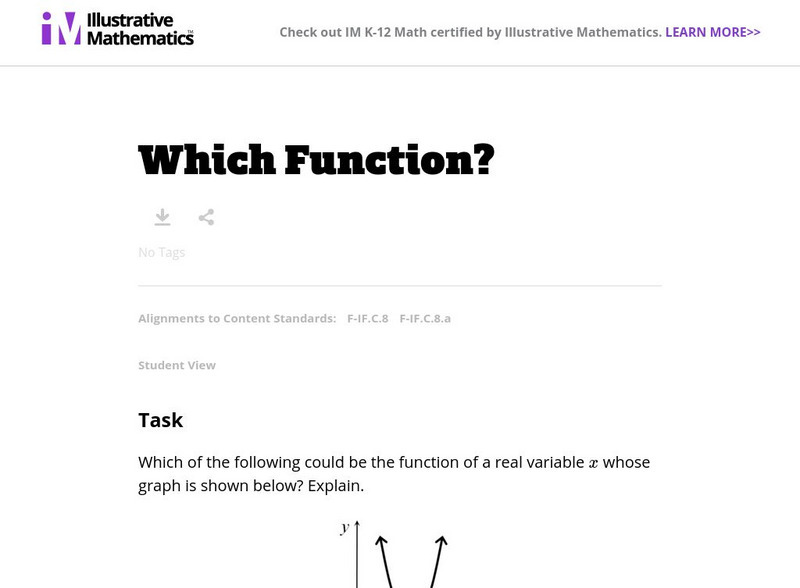
Illustrative Mathematics: F if Which Function?
For this task, young scholars are presented with a graph and asked to identify the functions that could be represented by it and explain their thinking. The task addresses knowledge related to interpreting forms of functions derived by...
Shodor Education Foundation
Shodor Interactivate: Two Variable Function Pump
Enter two complex numbers (z and c) as ordered pairs of real numbers, then click a button to iterate step by step. The iterates are graphed in the x-y plane and printed out in table form.
Lawrence Hall of Science
The Math Page: Topics in Pre Calculus: Basic Graphs
Here is a site that clearly and thoroughly explains the graphs of the major mathematical functions. There are example problems solved, problems for the student to attempt, and answers to the student problems. Point this site out to...
Curated OER
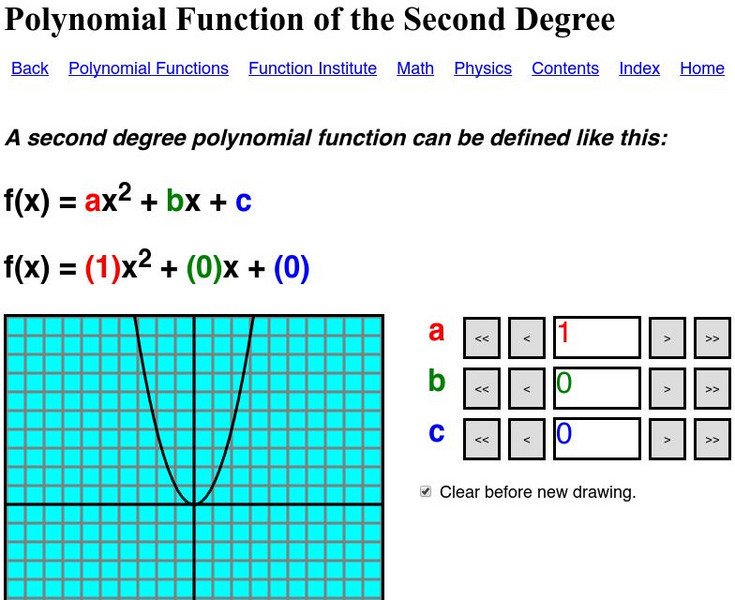
Zona Land/the Function Institute/poly. Functions/graphs
Contains an applet that allows you to graph quadratic functions. An example is given and it lets you change the coefficient values.
Interactive Mathematics
Interactive Mathematics: The Graph of a Function
Several examples are presented to demonstrate the process of graphing functions, including linear, quadratic, and rational functions.
Texas A&M University
Wtamu Virtual Math Lab: Intermediate Algebra
This site is a tutorial for students in algebra 2 or for those who need a refresher. The site has explanations, definitions, examples, practice problems and practice tests are found covering topics such as linear equations, graphing,...
Integrated Publishing
Integrated Publishing: Graphical Solution
This site explains how graphing can be used to solve (find the roots of) a quadratic equation. Practice problems are included.
Math Medics
S.o.s. Math: Algebra
This lesson provides basic instruction on the major concepts in algebra. Content includes a focus on fractions, units of conversion, complex numbers, quadratic equations, factorization and roots of polynomials, solving equations, systems...
Sophia Learning
Sophia: Comparing Linear, Quadratic, and Exponential Functions
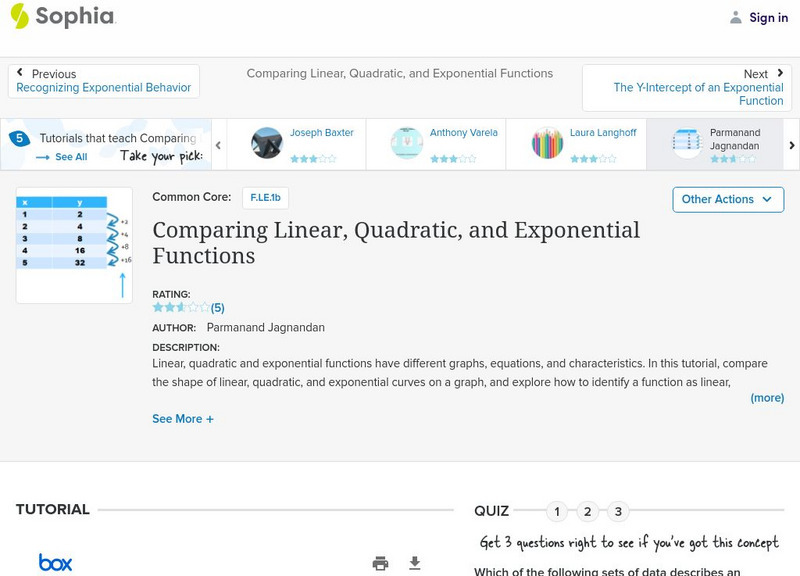
Linear, quadratic and exponential functions have different graphs, equations, and characteristics. In this tutorial, compare the shape of linear, quadratic, and exponential curves on a graph, and explore how to identify a function as...
Math Graphs
Houghton Mifflin: Math Graphs: Fitting Models to Scatter Plots 1 [Pdf]
Learners use a scatter plot to determine whether data can be modeled by a linear function, a quadratic function, a trigonometric function, or that there appears to be no relationship between x and y. The resource consists of an enlarged...


