Math Worksheets Land
Halloween Cartesian Art: Bat
Get the class batty over graphing. Young mathematicians plot ordered pairs in all quadrants of a Cartesian plane, and connect the points to create a bat.
Math Drills
Halloween Cartesian Art: Witch Hat
What is the mystery picture? After plotting points on the first quadrant of a Cartesian coordinate system, young mathematicians connect the points to create a Halloween-themed picture.
Math Drills
Thanksgiving Cartesian Art: Pilgrim Hat
What did some Pilgrims wear on top of their heads? Individuals graph sets of ordered pairs, and connect the points to create a mystery Thanksgiving picture.
Math Drills
Thanksgiving Cartesian Art: Pumpkin
Not a Halloween jack-o-lantern, but a Thanksgiving pumpkin! Young mathematicians graph and connect points on a coordinate system to unveil the mystery picture.
Math Drills
Thanksgiving Cartesian Art: Mayflower
How did the Pilgrims arrive to America? Middle schoolers graph ordered pairs on a coordinate system, connect the points, and discover a mystery picture—the Mayflower.
Math Drills
Christmas Cartesian Art Santa
Santa has his eye on you in a graphing activity that has young mathematicians plot ordered pairs on a Cartesian plane. After joining the points together, a picture of jolly Santa Claus comes to life.
Math Drills
Christmas Cartesian Art Tree
Spruce up graphing practice with an activity that has young mathematicians plot points on a coordinate plane, and then connect the points to create a Christmas tree.
Math Drills
Christmas Cartesian Art Snowflake
A festive math instructional activity hones graphic skills and keeps the season bright! Young mathematicians join points in the order they were graphed to create a snowflake picture.
Shodor Education Foundation
Graph Sketcher
Sketch graphs with the Graph Sketcher. Scholars graph functions on a coordinate plane. An interactive makes it as easy as inputting the function and clicking a button.
Shodor Education Foundation
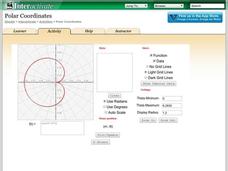
Polar Coordinates
Polar opposites might not work together—but polar coordinates do! The interactive provides learners the opportunity to graph trigonometric and algebraic functions using polar coordinates. The program takes either individual data points...
Curated OER
Point Reflection
Use this task as an exit ticket for your eight graders during the geometry unit. All they need to do is identify the coordinates of a point reflected over y=2000.
EngageNY
Graphing Rational Functions
Put everything together in a picture. Scholars take what they learned in the previous three lessons in the 15th segment of a 23-part unit to graph rational functions. They find the end behavior, the horizontal and vertical asymptotes if...
Charleston School District
Graphing Functions
How do letters and numbers create a picture? Scholars learn to create input/output tables to graph functions. They graph both linear and nonlinear functions by creating tables and plotting points.
Concord Consortium
Rational and Not So Rational Functions
Do not cross the line while graphing. Provided with several coordinate axes along with asymptotes, pupils determine two functions that will fit the given restrictions. Scholars then determine other geometrical relationships of asymptotes...
Shodor Education Foundation
Graphit
No graphing calculator? No worries, there's an app for that! Young mathematicians use an app to graph functions. In addition, they can also plot data points.
EngageNY
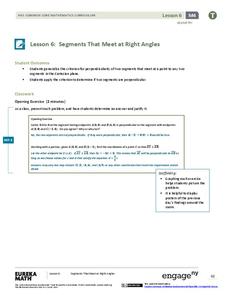
Segments That Meet at Right Angles
Can segments be considered perpendicular if they don't intersect? Learners look at nonintersecting segments on the coordinate plane and make conclusions about the lines that contain those segments. They determine if they are...
Shodor Education Foundation
Conic Flyer
Graphing conics made easy. Individuals use an interactive to graph conic sections. The app can handle circles, vertical and horizontal parabolas, ellipses, and vertical and horizontal hyperbolas.
Shodor Education Foundation
Scatter Plot
What is the relationship between two variables? Groups work together to gather data on arm spans and height. Using the interactive, learners plot the bivariate data, labeling the axes and the graph. The resource allows scholars to create...
Shodor Education Foundation
Sequencer
Take the first step into graphing sequences. Learners set the starting number, multiplier, add-on, and the number of steps for a sequence. Using the inputs, the interactive calculates and plots the sequence on the coordinate plane. Users...
Noyce Foundation
Photographs
Scaling needs to be picture perfect. Pupils use proportional reasoning to find the missing dimension of a photo. Class members determine the sizes of paper needed for two configurations of pictures in the short assessment task.
EngageNY
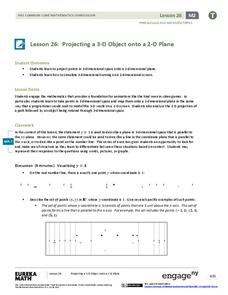
Projecting a 3-D Object onto a 2-D Plane
Teach how graphic designers can use mathematics to represent three-dimensional movement on a two-dimensional television surface. Pupils use matrices, vectors, and transformations to model rotational movement. Their exploration involves...
Balanced Assessment
Getting Closer
Flip the script! Reverse the situation and ask the class to find the function given asymptotes. The task requires class members to use their knowledge of functions and asymptotes to create functions that have a given asymptote or...
Shodor Education Foundation
Data Flyer
Fit functions to data by using an interactive app. Individuals plot a scatter plot and then fit lines of best fit and regression curves to the data. The use of an app gives learners the opportunity to try out different functions to see...
Geophysical Institute
Latitude and Longitude with Google Earth
Travel the world from the comfort of your classroom with a lesson that features Google Earth. High schoolers follow a series of steps to locate places all over the earth with sets of coordinates. Additionally, they measure the distance...


