PBS
Pbs Learning Media: Arthur: All About Community
Use these ARTHUR activities to help children understand themselves and those around them. Topics include self-esteem, understanding others, and cultural diversity.
Houghton Mifflin Harcourt
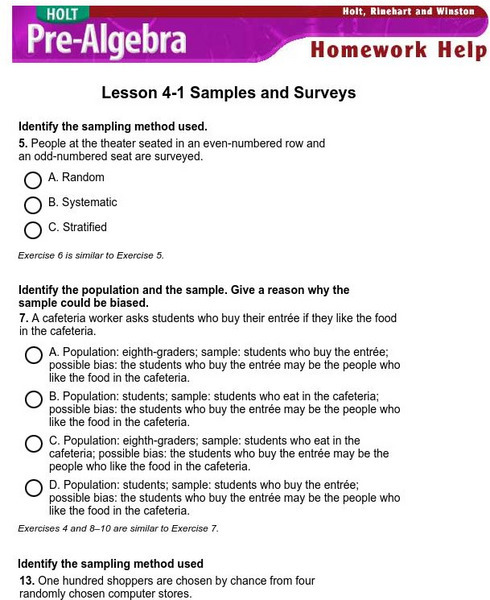
Holt, Rinehart and Winston: Homework Help Independent Practice: Samples and Surveys
Get independent practice working with samples and surveys. Each incorrect response gets a text box explanation and another try. Correct responses are confirmed.
US Department of Education
Nces Kids: Creating an Area Graph
This is where you will find step by step directions explaining how to create an area graph. Complete each step and click on the next tab. Directions are simple and clear.
Texas Instruments
Texas Instruments: Measures of Central Tendency Activity: Height of the Class
The purpose of this lesson is to have students create a box and whiskers plot from collecting class data of each person's height.
Texas Instruments
Texas Instruments: How Strong Is Your Bridge?
Build a bridge of straw and straight pins. Data is collected and analyzed with handhelds by the students measuring the height of the bridge vs the number of marbles (in a cup.)
Texas Instruments
Texas Instruments: Distance vs. Time to School
This is a linear activity where the teacher and/or students collect data about the distance they live from school and how long it takes to get to school. This is a modeling activity where time is the dependent variable.
Texas Instruments
Texas Instruments: Pass the Ball
In this activity, students use mathematics to examine patterns that occur in a specific scenario and predict future events for the scenario. Data is collected on the time it takes to pass a ball. The students plot graphs, fit the data...
Texas Instruments
Texas Instruments: Curve Ball
In this activity, students collect data for a bouncing ball using a motion detector. They analyze the data and attempt to find a model for the height of the ball as a function of time.
Texas Instruments
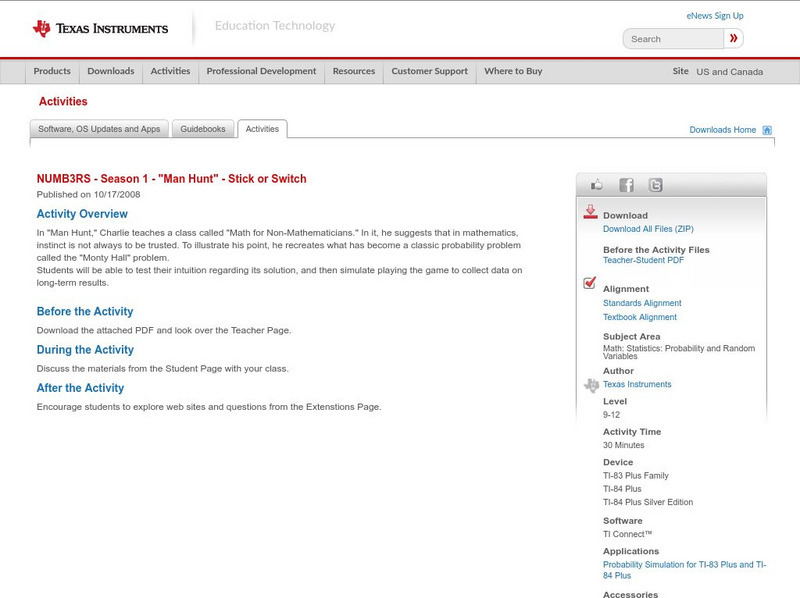
Texas Instruments: Numb3 Rs: Stick or Switch
Based off of the hit television show NUMB3RS, this lesson creates a simulation of the famous "Monty Hall Problem" (also known as the Three Doors Dilemma). In the simulation, students discover whether making certain decisions increase or...
Texas Instruments
Texas Instruments: Scatter Plots
Basic activity of collecting data and graphing sets of data to see if there is a relationship.
Texas Instruments
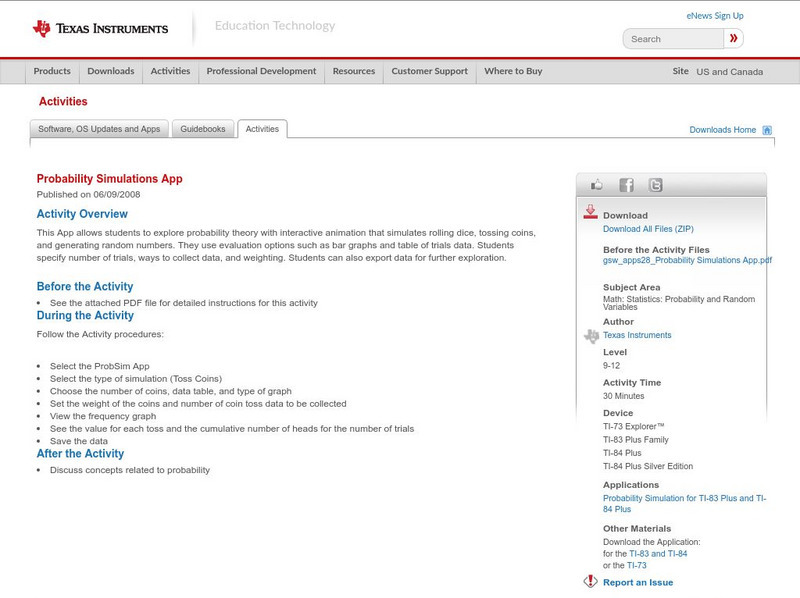
Texas Instruments: Probability Simulations App
This App allows students to explore probability theory with interactive animation that simulates rolling dice, tossing coins, and generating random numbers. They use evaluation options such as bar graphs and table of trials data....
Texas Instruments
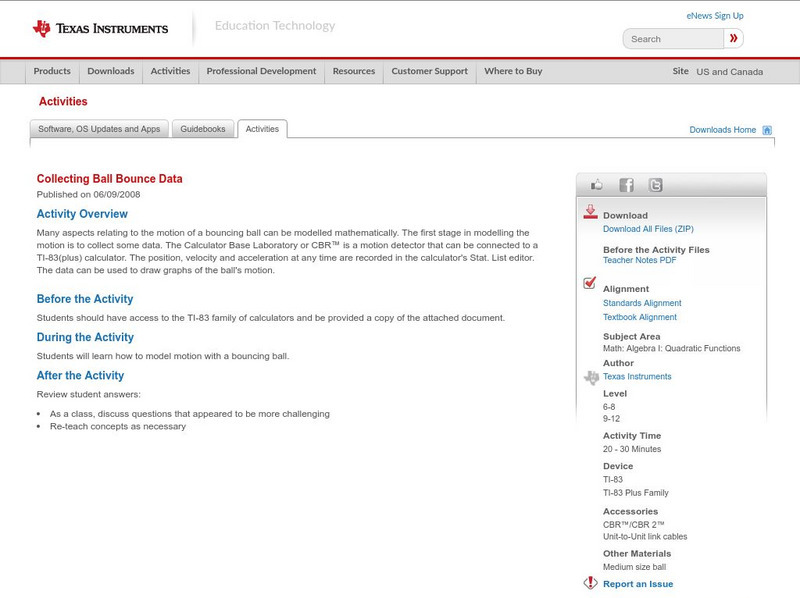
Texas Instruments: Collecting Ball Bounce Data
Many aspects relating to the motion of a bouncing ball can be modelled mathematically. The first stage in modelling the motion is to collect some data. The Calculator Base Laboratory or CBR is a motion detector that can be connected to a...
Texas Instruments
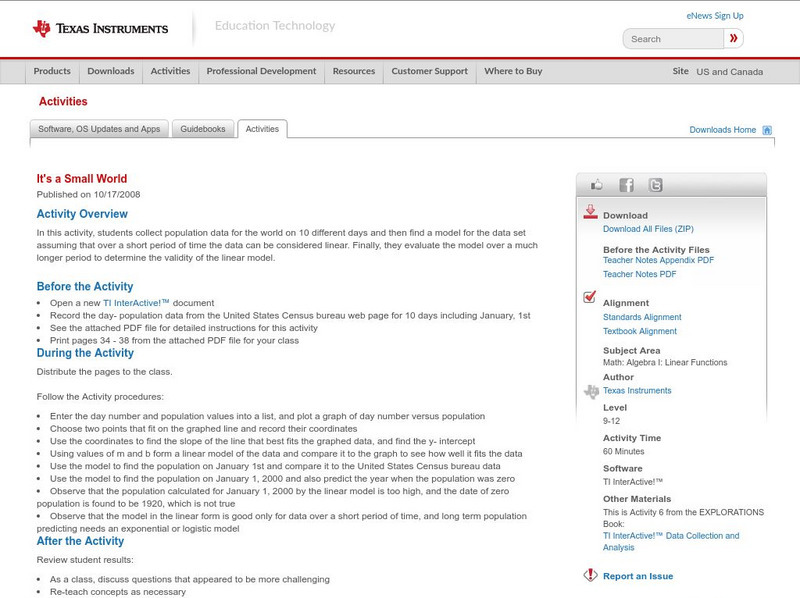
Texas Instruments: It's a Small World
In this activity, students collect population data for the world on 10 different days and then find a model for the data set assuming that over a short period of time the data can be considered linear. Finally, they evaluate the model...
Texas Instruments
Texas Instruments: Line of Best Fit
In this activity, students learn to collect data and plot the data. They use the manual-fit feature to form a line of best fit.
Texas Instruments
Texas Instruments: Collecting Data
In this activity, students investigate how to use random numbers to collect samples and how to randomly assign subjects to experiments to collect data. They also use the CBL system to collect data in real time.
Texas Instruments
Texas Instruments: Solving a System of Linear Equations
In this activity, students' will collect and analyze motion data in order to determine the solution to a linear system of equations. They graph two motions on a common axis and find their intersection.
Texas Instruments
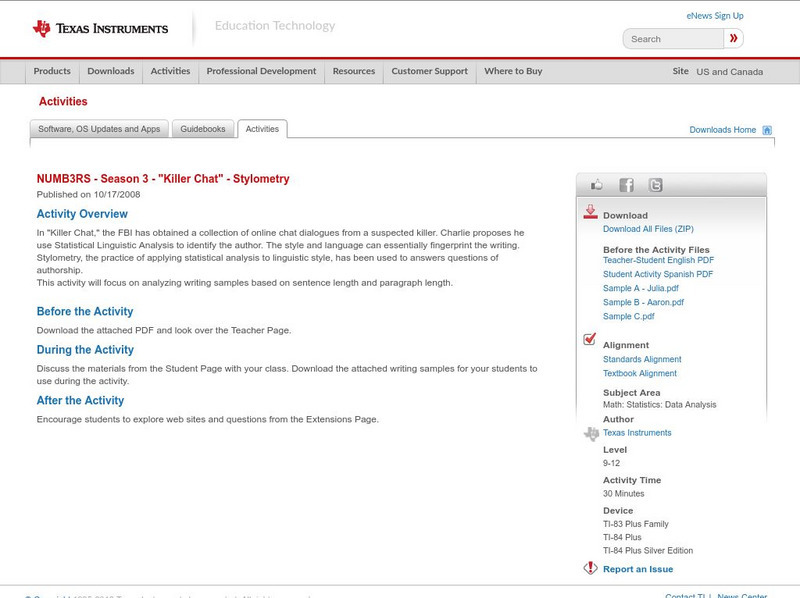
Texas Instruments: Numb3 Rs: Stylometry
Based off of the hit television show NUMB3RS, this lesson has students analyze two samples of writing to determine who is the author of a third piece of writing. While the actual statistics would be overwhelming for students, this lesson...
Texas Instruments
Texas Instruments: Collecting Data in Geometry
This activity is designed for students to make conjectures about triangles. Students will create three lists to represent the measures of the angles of the triangle. The entire class list will then be sent to each student for analysis,...
Texas Instruments
Texas Instruments: Making Conjectures and Planning Studies
This activity introduces students to the concept of collecting and analyzing data and using conjectures to formulate new questions.
Texas Instruments
Texas Instruments: Gemini Candy
In this activity, students work in groups to collect data and draw conclusions from random samples simulated by drawing tiles from a bag. They represent the data collected in the form of a triple bar graph.
Texas Instruments
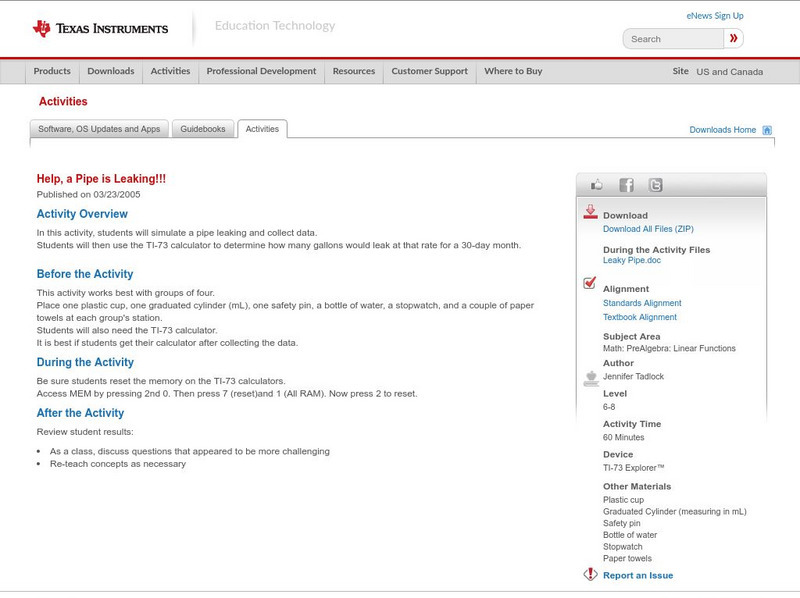
Texas Instruments: Help, a Pipe Is Leaking!!!
In this activity, students will simulate a pipe leaking and collect data. Students will then use the TI-73 calculator to determine how many gallons would leak at that rate for a 30-day month.
Texas Instruments
Texas Instruments: How Many States Have You Visited?
This is a beginner activity for students Using the TI-84. Students will collect data from the class and create a Box & Whisker plot based on how many States students have visited. This is easy for the teacher to learn, and steps are...
Texas Instruments
Texas Instruments: How Do You Measure Up?
In this activity, students graph scatter plots to investigate possible relationships between two quantitative variables. They collect data and analyze several sets of data pairing the two quantities.
Texas Instruments
Texas Instruments: Learning Measurement Conversions Through Statistics
Students learn the conversion relationship between inches and centimeters through data collection. The data collected results from measuring items using inches and centimeters as the units. They use a TI-73 to input the data into lists...


