Curated OER
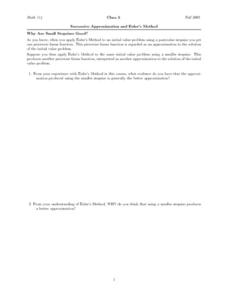
Successive Approximation and Euler's Method
In this approximation worksheet, students use the Euler's method to interpret a piecewise linear function. They explore why the approximation produced using a smaller stepsize is a better approximation. This four-page worksheet...
Curated OER
Linear Systems: Other Methods of Computing Determinants
In this computing determinants worksheet, students explore methods of computing determinants. They complete determinant problems by using the co-factor method, the "big formula" and the use of product of the pivots. This two-page...
Curated OER
Reflections of a Linear Function
Students reflect functions about the X-axis, Y-axis, and origin. They derive equations for reflected functions using the website www.explorelearning.com.
Curated OER
Absolute Value of Linear Functions
Learners identify and interpret how absolute value affects linear functions. They also graph linear functions and reflect them in a line of symmetry. Finally, students evaluate the absolute value of a constant using technology to...
Curated OER
Reflections of a Linear Function
Students identify and reflect functions about the X-axis, Y-axis, and origin. They derive equations for reflected functions and graph the linear functions. Finally, students identify that f(x) can be reflected about each axis and the...
Shodor Education Foundation
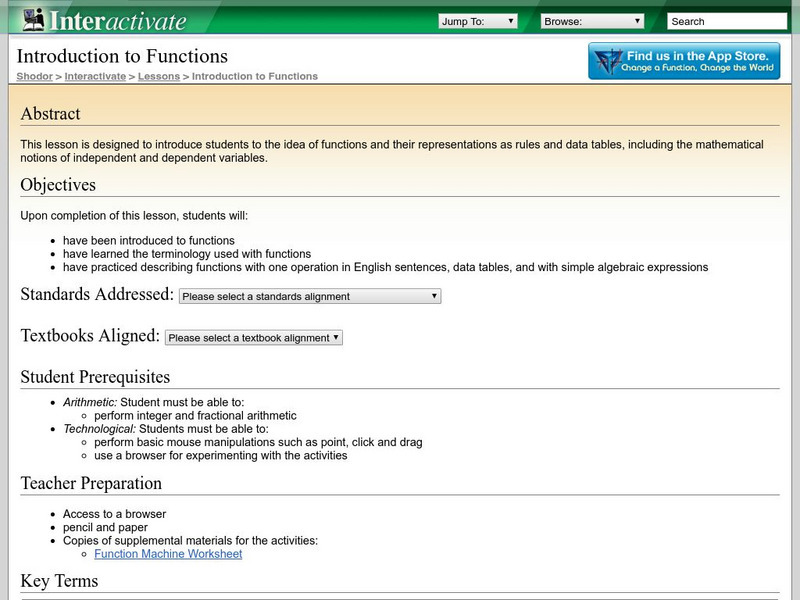
Shodor Interactivate: Lesson: Introduction to Functions
Input numbers into the function machine and explore independent and dependent variables.
University of Vienna (Austria)
University of Vienna: The Big Function Graph Puzzle
Interactive matching game where linear and quadratic expressions are matched to their associated functions graphs. Site features over 100 graphs, although only six are used at one time.
Texas Instruments
Texas Instruments: Explore Graphs and Factors
Students use a graphing calculator to explore the relationship between the linear factors of a quadratic function and its zeros. They learn that the x-intercepts and axis of symmetry of a quadratic function can be determined from its...
PBS
Pbs Mathline: Mystery Liquids Lesson Plan [Pdf]
Learners gather data from two mystery liquids to explore linear functions. Printable lesson.
Other
Desmos: Modeling Bundle
A collection of activities where students investigate mathematical modeling. Activities involve different types of functions, how to examine context and decide on a model, and limitations.
University of Colorado
University of Colorado: Ph Et Interactive Simulations: Graphing Lines
Explore the world of lines. Investigate the relationships between linear equations, slope, and graphs of lines.
TeachEngineering
Teach Engineering: Walk the Line: A Module on Linear Functions
This module leads students through the process of graphing data and finding a line of best fit while exploring the characteristics of linear equations in algebraic and graphic formats. Then, these topics are connected to real-world...
TeachEngineering
Teach Engineering: The Challenge Question: "Walk the Line"
Students are introduced to the "Walk the Line" challenge question. They are asked to write journal responses to the question and brainstorm what information they need to answer the question. Ideas are shared with the class (or in pairs...
Texas Education Agency
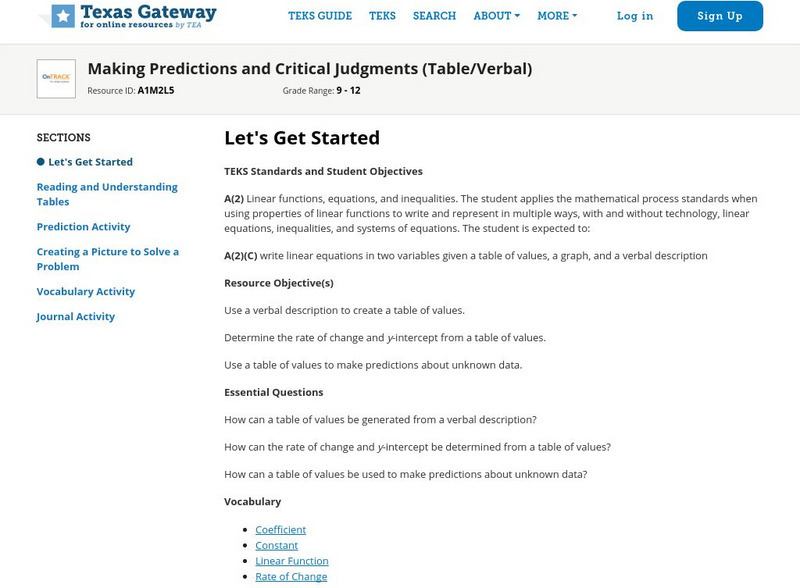
Texas Gateway: Making Predictions and Critical Judgments (Table/verbal)
Given verbal descriptions and tables that represent problem situations, the student will make predictions for real-world problems.
Texas Education Agency
Texas Gateway: Modeling Data With Linear Functions
Given a scatterplot where a linear function is the best fit, the student will interpret the slope and intercepts, determine an equation using two data points, identify the conditions under which the function is valid, and use the linear...
Varsity Tutors
Varsity Tutors: Hotmath: Practice Problems: Functions and Their Graphs
Thirty-three problems present a variety of practice graphing a relation and checking to see if it is a function. They are given with each step to the solution cleverly revealed one at a time. You can work each step of the problem then...
Texas Education Agency
Texas Gateway: Writing Verbal Descriptions of Functional Relationships
Given a problem situation containing a functional relationship, the student will verbally describe the functional relationship that exists.
Texas Education Agency
Texas Gateway: Determining Parent Functions (Verbal/graph)
Given a graph or verbal description of a function, the student will determine whether the parent function is quadratic or linear.
Texas Education Agency
Texas Gateway: Determining Reasonableness of Solutions (System of Equations)
Given verbal descriptions of situations involving systems of linear equations, the student will determine the reasonableness of the solutions to the system of equations.
Texas Education Agency
Texas Gateway: Determining Slopes From Equations, Graphs, and Tables
Given algebraic, tabular, and graphical representations of linear functions, the student will determine the slope of the relationship from each of the representations.
Texas Education Agency
Texas Gateway: Determining the Domain and Range for Linear Functions
Given a real-world situation that can be modeled by a linear function or a graph of a linear function, the student will determine and represent the reasonable domain and range of the linear function using inequalities.
Texas Education Agency
Texas Gateway: Developing the Concept of Slope
Given multiple representations of linear functions, the student will develop the concept of slope as a rate of change.
Texas Education Agency
Texas Gateway: Direct Variation and Proportional Change
The student will use a variety of methods inculding tables, equations and graphs to find the constant of variation and missing values when given a relationship that varies directly.
Texas Education Agency
Texas Gateway: Domain and Range: Contextual Situations
The student will be able to identify and determine reasonable values for the domain and range from any given contextual situation.


