Illustrative Mathematics
Illustrative Mathematics: F if Logistic Growth Model, Abstract Version
For this task, young scholars are presented with an equation for a logistic growth model and are asked to analyze it. They are then questioned about a graph showing bacterial population growth. Next, they must use information from...
Illustrative Mathematics
Illustrative Mathematics: F If.6 Mathemafish Population
For this task, learners are presented with a table and a graph and are asked to summarize the data and report the findings of a project by the Environmental Protection Agency to contain the effects of an invasive species on a fish...
Illustrative Mathematics
Illustrative Mathematics: F if Telling a Story With Graphs
For this task, students are presented with three weather-related graphs - on temperature, solar radiation, and precipitation. They are asked to describe the function represented in each graph and tell a more detailed story using...
Illustrative Mathematics
Illustrative Mathematics: F if How Is the Weather?
For this task, learners are presented with three graphs that show solar radiation as a function of time. They are asked to match each graph to the corresponding description of the weather during the day. Aligns with F-IF.B.4.
Illustrative Mathematics
Illustrative Mathematics: F if Identifying Graphs of Functions
For this task, learners are presented with four function equations and four graphs of functions showing -2 less than or equal to x, which is less than or equal to +2. They are asked to match each function to the corresponding graph and...
Illustrative Mathematics
Illustrative Mathematics: F if Warming and Cooling
Students are presented with a graph showing temperature over a period of 20 hours and are asked to read and interpret the graph. Aligns with F-IF.B.4.
Illustrative Mathematics
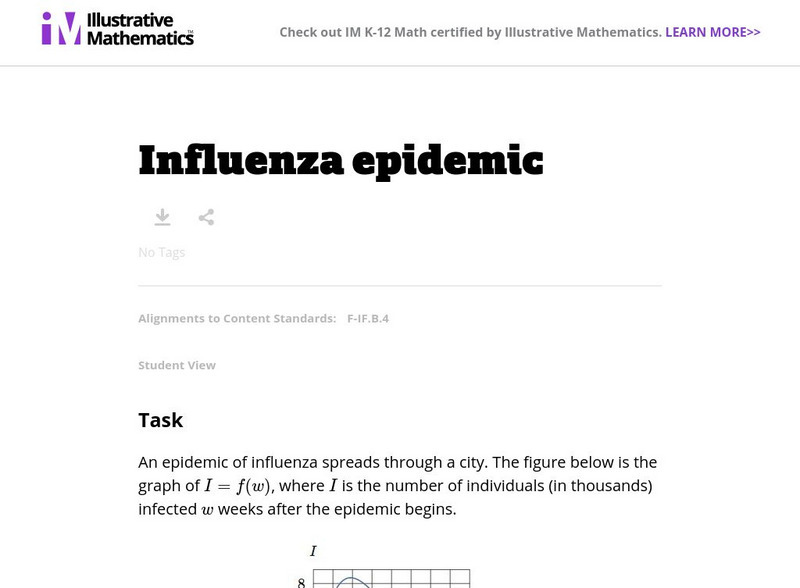
Illustrative Mathematics: F if Influenza Epidemic
Students are presented with a graph showing the spread of an influenza epidemic through a city. They are asked to read and interpret the graph and the equation for its function. Aligns with F-IF.B.4.
Illustrative Mathematics
Illustrative Mathematics: 8.f Bike Race
Eighth graders are presented with the distance-time graphs of two bike riders in a race. They are to identify the winner and write a story describing what is happening during the race based on the shapes of the graphs. Aligns with 8.F.B.5.
Illustrative Mathematics
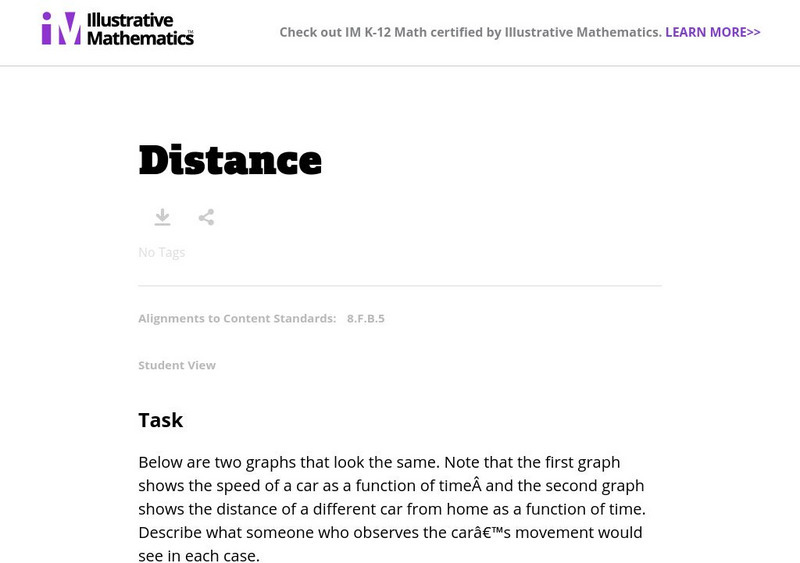
Illustrative Mathematics: 8.f Distance
Eighth graders are presented with the graphs of two cars traveling. One shows distance from home versus time and the other shows speed versus time. Students are to write a description of what might be happening during each car's...
Illustrative Mathematics
Illustrative Mathematics: 8.f Tides
In this problem, 8th graders are presented with a graph showing high and low tides and are asked to analyze it. Aligns with 8.F.B.5.
Illustrative Mathematics
Illustrative Mathematics: 8.f Chicken and Steak, Variation 1
This task has students find a linear function that will calculate the amount of chicken and steak to purchase in order to stay within a given budget. Students then graph the function and interpret it. Aligns with 8.F.B.4.
Rice University
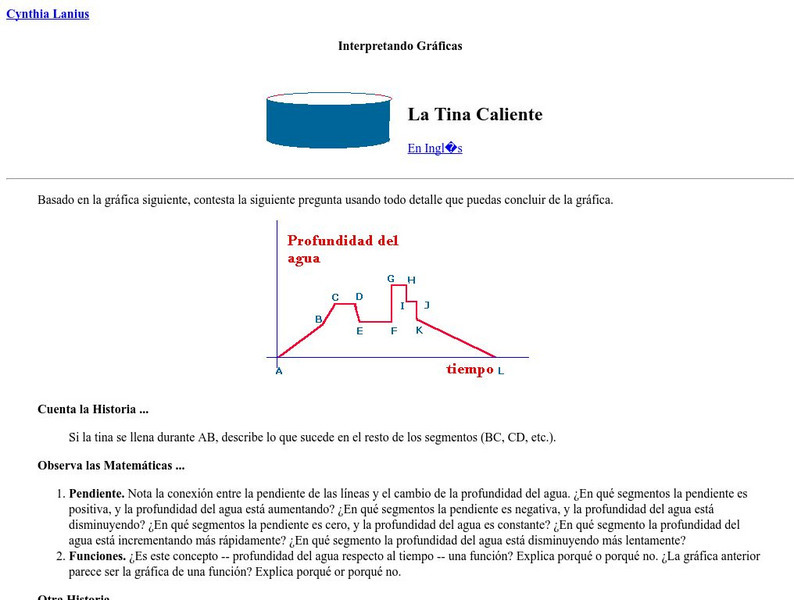
Rice University: Cynthia Lanius: Interpretando Graficas: La Tina Caliente
An example problem in Spanish of interpreting a graph. Gives the student many questions to think about, including slope and if the graph serves as a function. Does not offer solutions or answers. Includes link to the English version.
US Department of Education
Nces Kids: Create an Xy Graph
This is where you can find a step by step explanation of how to create an XY graph. When you finish each step just click the next tab and you will find the next set of instructions.
Khan Academy
Khan Academy: Interpreting Graphs of the Production Possibilities Curve (Ppc)
Practice what you have learned about the production possibilities curve (PPC) in this four-question exercise.
PBS
Pbs: Location Graphs
Use your skills of deduction to fill in the missing information and demonstrate your expertise at interpreting graphs. This interactive exercise focuses on how line graphs can be used to represent data and provides an opportunity to...
National Council of Teachers of Mathematics
The Math Forum: Urban Systemic Initiative/oceans of Data
This site includes questions related to reading and understanding graphs. There are links on this site to lesson plans, benchmarks, and other webpages all of which mostly center about probability and statistics.
Math Graphs
Houghton Mifflin: Math Graphs: Interpreting a Graph 2 [Pdf]
Learners identify or sketch quantities using a given graph. The resource consists of an enlarged printable version of a math graph available in PDF format.
Math Graphs
Houghton Mifflin: Math Graphs: Average Rate of Change 1 [Pdf]
Students use the graph of "f" to determine the average rate of change and sketch a tangent line. The problem is available in PDF format.
Math Graphs
Houghton Mifflin: Math Graphs: Interpreting a Graph 3 [Pdf]
Students identify or sketch quantities using a given graph. The resource consists of an enlarged printable version of a math graph available in PDF format.
ClassFlow
Class Flow: Graphs Questions
[Free Registration/Login Required] In this Flipchart, student's knowledge of reading graphs is assessed.
Houghton Mifflin Harcourt
Holt, Rinehart and Winston: Homework Help Independent Practice: Interpreting Graphs and Tables
Get independent practice interpreting graphs and tables. Each incorrect response gets a text box explanation and another try. Correct responses are confirmed.


