Other
Stat Soft: Multiple Regression
This resource has a lot of information on multiple regression. It also contains information on the regression line.
Texas Education Agency
Texas Gateway: Interpreting Scatterplots
Given scatterplots that represent problem situations, the student will determine if the data has strong vs weak correlation as well as positive, negative, or no correlation.
Texas Education Agency
Texas Gateway: Modeling Data With Linear Functions
Given a scatterplot where a linear function is the best fit, the student will interpret the slope and intercepts, determine an equation using two data points, identify the conditions under which the function is valid, and use the linear...
Math Is Fun
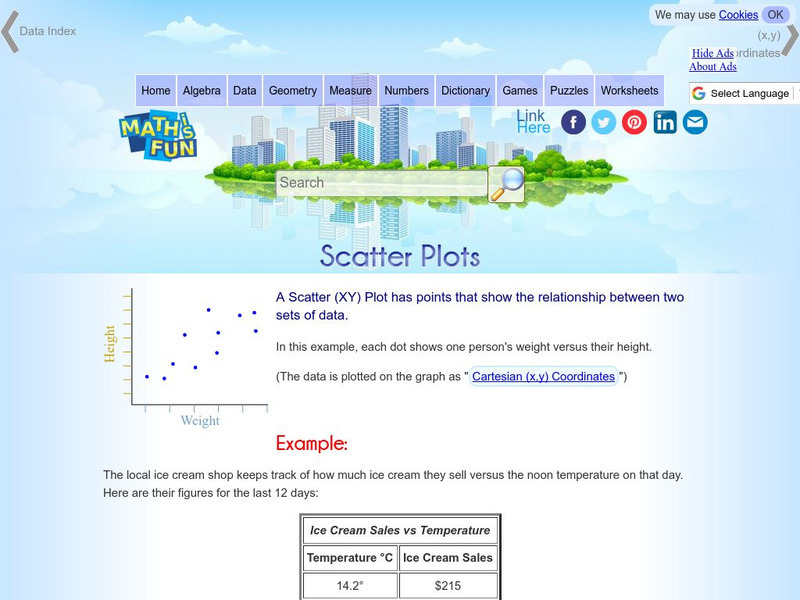
Math Is Fun: Scatter Plots
Explains, with examples, what scatter plots are and how to interpret the data. Discusses trends, interpolation and extrapolation, and correlation. Includes a set of practice questions.
University of Colorado
University of Colorado: Ph Et Interactive Simulations: Least Squares Regression
Create your own scatter plot or use real-world data and try to fit a line to it. Explore how individual data points affect the correlation coefficient and best-fit line.
Other
Online Statistics Education: Graphing Distributions [Pdf]
This is the second chapter of a statistics e-text developed collaboratively by Rice University, University of Houston Clear Lake, and Tufts University. It looks at many different types of data displays and the advantages and...
Oswego City School District
Regents Exam Prep Center: Regression Analysis
A collection of lesson ideas, a practice activity, and teacher resources for exploring regression analysis.
Oswego City School District
Regents Exam Prep Center: Scatter Plots and Line of Best Fit
Use this lesson, practice exercise, and teacher resource in planning instruction on scatter plots and line of best fit. In the lessons, you'll find definitions and examples of ways to make a scatter plot, determine correlations, and find...
Texas Education Agency
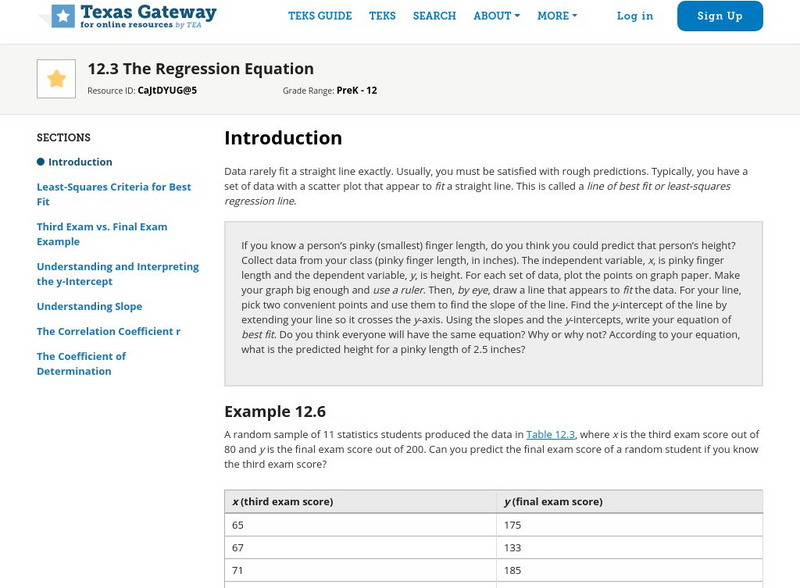
Texas Gateway: Tea Statistics: The Regression Equation
A tutorial on how to find the line of best fit or least-squares regression line for a set of data in a scatter plot using different methods and calculations.
Texas Education Agency
Texas Gateway: Analyzing Scatterplots
Given a set of data, the student will be able to generate a scatterplot, determine whether the data are linear or non-linear, describe an association between the two variables, and use a trend line to make predictions for data with a...
US Department of Education
National Center for Education Statistics: Create a Graph Tutorial
This tutorial walks students through how to create different types of graphs using the Create a Graph tool available on the website. Covers bar graphs, line graphs, pie charts, area graphs, scatter plots, and dependent and independent...
Alabama Learning Exchange
Alex: My Peanut Butter Is Better Than Yours!
This lesson plan provides a real-world example of using a scatter plot to compare data. It gives an assessment and ideas for remediation, extension as well as ways to manage behavior problems and reluctant learners.
Cuemath
Cuemath: Scatter Plot
A comprehensive guide for learning all about scatter plots with definitions, how to construct and solve them, types of scatter plots, solved examples, and practice questions.
OER Commons
Oer Commons: Measuring Circles
Seventh graders will measure the circumference and diameter of round things in the classroom and discover the ratio pi. They will see that the ratio of a circle's circumference to its diameter can be used to solve for the circumference...
BSCS Science Learning
Bscs: Budburst Lilac Festival
For this Inquiry, students predict the best date to host a lilac blossom festival so that lilacs are in full bloom in the city where students live. Students are introduced to Project Budburst, a citizen science project in which...
Houghton Mifflin Harcourt
Holt, Rinehart and Winston: Homework Help Independent Practice: Scatter Plots
Get independent practice working with scatter plots. Each incorrect response gets a text box explanation and another try. Correct responses are confirmed.
Duke University
Duke University: Introduction to Linear Regression
This page discusses linear regression, its equations, background, and applications. Provides questions, answers, formulas, and explanations for understanding.
University of Regina (Canada)
University of Regina: Math Central: Scatter Plots
Three different concepts are examined about scatter plots. Topics featured are collecting data, analyzing scatter plots, and determining a line of "best fit". The lesson has an overview, material, procedures, and evaluation techniques.
University of South Florida
Florida Center for Instructional Tech: Famous People
Students estimate the ages of famous people, then create a scatterplot with the actual ages. This activity allows them to estimate with linear equations. You can access the age data through the "activity" link.
University of Georgia
University of Georgia: Definitions in Statistics
This site contains definitions to use in statistics and ways to collect data.
Richland Community College
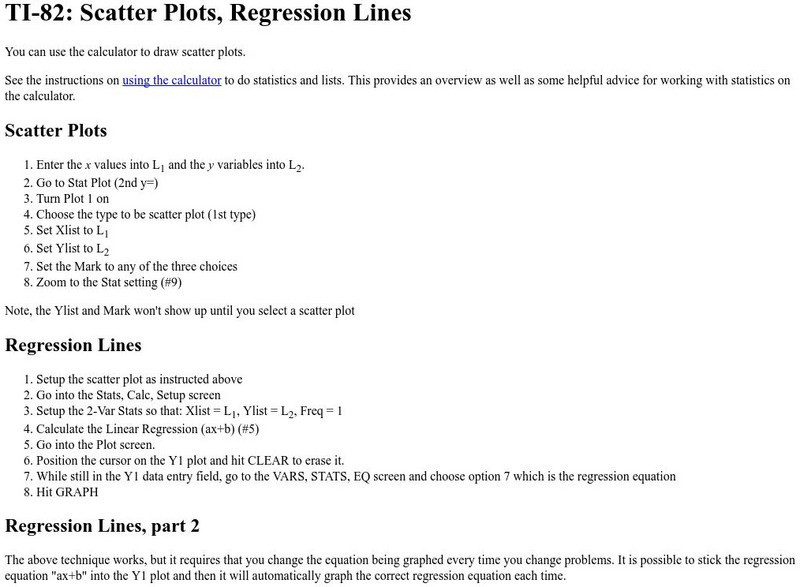
Richland Community: Ti 82 Manual for Scatter Plots
This website from the Richland Community College is useful for owners who have the TI-82 and need to know how to set up the scatter plot. Step by step procedure helps for easy set-up.
Shodor Education Foundation
Shodor Interactivate: Interactive: Scatter Plot
Use this interactive applet to input a series of (x, y) ordered pairs and plot them. Parameters such as minimum and maximum value, minimum and maximum y value, and x- and y-scale can be set by the user or determined by the applet.


