Curated OER
Home Smart Home
How smart is your home? Middle and high schoolers write a journal entry describing the types of technology found in their homes. After reading an article, they are introduced to "smart" home technology. In groups, they identify and...
Curated OER
Tables
Can you read this table? Learners begin to comprehend data analysis through examining two simple tables and answering comprehension questions. The first gives characteristics about three animals in yes-or-no format (i.e. "eats insects,"...
Curated OER
Reading Tally Chart
As learners explore data analysis have them practice reading tally charts using these examples. They answer basic questions about each of three charts, employing addition and subtraction skills. For example, a chart tallying t-shirts...
Curated OER
Reading Tables
Who is two years younger than Meg? Who is older than Paul, but not Kinta? Scholars practice reading tables as they answer comprehension questions based on three sets of data. First, they examine a table depicting ages, then favorite...
Education World
The African American Population in US History
How has the African American population changed over the years? Learners use charts, statistical data, and maps to see how populations in African American communities have changed since the 1860s. Activity modifications are included to...
Curated OER
Did Voters Turn Out -- or Are They Turned Off?
What was the voter turnout at your last state election? Examine voter turnout statistics from the most recent election to learn which ten states have the best turnout record. This lesson offers election data, handouts, and worksheets.
Curated OER
Where We Live
Who has the most? Young learners practice charting data using familiar information. They help fill out a classroom chart by recording the number of people, pets, televisions, etc. in their home. Guiding questions help them investigate...
Curated OER
How Many?
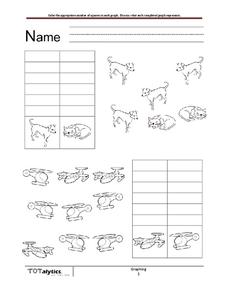
How many cats are there? Dogs? As learners examine a set of images, they fill in a chart to indicate how many of each image there are. In the first series, there are four dogs and two cats. In the second, there are three planes and six...
Curated OER
Setting Life Goals
By filling in this chart, participants identify in what ways they are successful, where they need to improve, and what their goals are in 6 areas of life ranging from family and friends to body and spirituality.
Curated OER
Problem Solving Strategy: Guess & Check
For this problem solving worksheet, students solve 11 different problems that include using the guess and check method to solve each one. First, they use the chart to figure out the number of and types of pets each person has. Then,...
Curated OER
A Proportional Fish Story
For this proportions worksheet, students identify and complete 8 different problems that include using proportions to build scale models of various animals. First, they use the scale to complete the chart and draw lines representing the...
Curated OER
Representing Data
Second and third graders answer questions based on data presented to them in graphs. They see how to interpret data from a bar graph, line graph, and a chart.
Curated OER
What Can You Find in the Cabinet?
Looking in the cabinet can be fascinating! Examine the various departments of the Executive Cabinet in this group research project, which jigsaws so each small group has a different department and presents to the class. Groups create...
Curated OER
Charts, Maps, and Graphs Lesson on the Holocaust
High schoolers practice interpreting data. In this Holocaust lesson plan, students research selected Internet sources and examine charts, maps, and graphs regarding the Jewish populations in and out of Europe. High schoolers respond to...
Curated OER
All That Corn
Students observe and record data. For this plant growth lesson, students plant and grow corn. Students observe the growth of their corn and record their data. Students read corn recipes and select their favorite four...
Curated OER
Weather
Learners create a spreadsheet and chart using data collected. In this weather lesson, students select five cities from their state, including the city they live in. Learners take daily temperature readings from all five...
Curated OER
Addition - regrouping
In this addition activity, 2nd graders add two digit numbers together in a regrouping chart. Students complete 12 addition with regrouping problems.
Curated OER
Multiplication Five Minute Frenzy (B)
In this multiplication worksheet, students fill in a multiplication chart that multiplies numbers 1 through 12. Students solve 100 problems.
Curated OER
Video Viewers
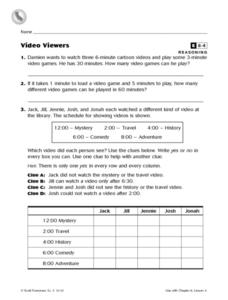
In this video viewers worksheet, 3rd graders solve 2 word problems dealing with watching videos, read and analyze 4 clues in order to fill in a chart correctly involving 5 people and the types of videos they watch.
Curated OER
Cricket Weather
In this collecting data worksheet, 4th graders use the data collected on crickets chirps and the temperature to make a line graph by following 4 directives.
Curated OER
What Did It Cost 100 Years Ago?
Students compare prices of good across the century in order to introduce the topic of inflation. They undertand the concepts of inflation and Consumer Price Index (CPI), use online calculators to figure the approximate cost of goods...
Curated OER
Working with Averages
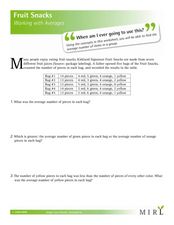
For this fruit snacks worksheet, students find the averages of different amounts of fruit snacks from a chart. Students complete 7 problems total.
Curated OER
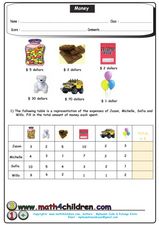
Money Chart
In this money instructional activity, students fill in the total amount of money for the number of items each student purchased with the item and price of each item given. Students complete 4 problems.
Curated OER
Geography of the Harbor
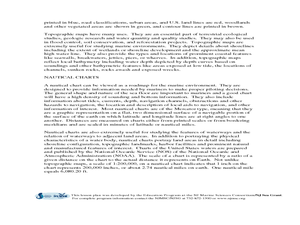
Students study estuaries and their boundaries. In this investigative instructional activity students locate an estuary on a map and use nautical and topographical maps.


