Curated OER
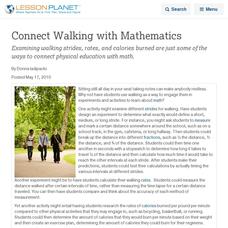
Connect Walking with Mathematics
Examining walking strides, rates, and calories burned are just some of the ways to connect physical education with math.
Curated OER
Bar Graphs With Intervals
Give your math class a comprehensive understanding of bar graphs with this series of lessons. The resource is divided into three parts, and all of the accompanying worksheets are included. The class will study different bar graphs,...
Illustrative Mathematics
Walk-a-thon 1
Your mathematician's job is to explore the relationship between hours and miles walked during a walk-a-thon. The activity compels your learners to experiment with different means in finding out this proportional relationship. The answer...
Curated OER
Making the Connection: Math and Architecture
Taking a walk around you town center can turn into a lesson about math and architecture.
EngageNY
Networks and Matrix Arithmetic
Doubling a network or combining two networks is quick and easy when utilizing matrices. Learners continue the network example in the second lesson of this series. They practice adding, subtracting, and multiplying matrices by a scalar...
Concord Consortium
Circling Trains
And round and round the park we go! Given a description of an amusement park with the locations of three attractions connected by walkways, learners consider what happens when additional attractions join the mix by doubling the length of...
Virginia Department of Education
Weather Patterns and Seasonal Changes
Get your class outside to observe their surroundings with a lesson plan highlighting weather patterns and seasonal changes. First, learners take a weather walk to survey how the weather affects animals, people, plants, and trees during...
Teach Engineering
Processes on Complex Networks
Introduces your class to random processes in networks with an activity that uses information about disease spread using the susceptible, infectious, resistant (SIR) model. Participants determine whether a susceptible person becomes...
Penn Museum
Penn Museum: China Gallery
Invite your learners to take a closer look at the art and mathematical function of dome buildings as designed by the ancient Romans. In the next segment of this attractive worksheet set, your young historians will then learn about...
MENSA Education & Research Foundation
Shapes - Kindergarten
Extend scholars' learning experience with a unit consisting of five shape lesson plans, an extension activity, assessment, and rubric. Begin by reading a story about shapes, then conduct an overview and assign pupils' their first...
Curated OER
Walking on Air
Students collect and analyze data with a graph. For this statistics lesson, students use central tendencies to find the meaning of their data. They display the data on a Ti calculator.
EngageNY
Measuring Variability for Symmetrical Distributions
How do we measure the deviation of data points from the mean? An enriching activity walks your class through the steps to calculate the standard deviation. Guiding questions connect the steps to the context, so the process is not about...
Curated OER
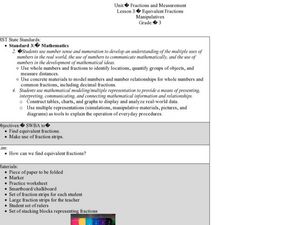
Equivalent Fractions Manipulatives
Students study fractions. In this equivalent fractions lesson, students utilize fraction strips to enhance their understanding of equivalent fractions. They watch a demonstration and then work independently with their own set of fraction...
Teach Engineering
Matching the Motion
It is not always easy to walk the straight and narrow. In the sixth portion of a nine-part unit, groups actively recreate a graph depicting motion. Individuals walk toward or away from a motion detector while trying to match a given...
Fredonia State University of New York
Watch Your Step…You May Collide!
Can two lines intersect at more than one point? Using yarn, create two lines on the floor of the classroom to find out. Cooperative groups work through the process of solving systems of equations using task cards and three different...
Curated OER
Cell Analogies!
Liken a cell and its organelles to a tiny person and its organs. After gathering information on cell structures and their functions, small groups collaborate to come up with an analogy of their own. They produce a collage describing the...
Curated OER
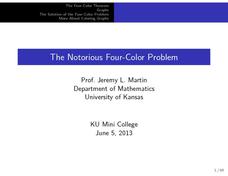
The Notorious Four-Color Problem
Take a walk through time, 1852 to 2005, following the mathematical history, development, and solution of the Four-Color Theorem. Learners take on the role of cartographers to study a United States map that is to be colored. One rule: no...
Curated OER
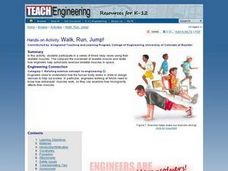
Walk, Run, Jump!
Students participate in a series of timed relay races using their skeletal muscles. They compare the movement of skeletal muscle and relate how engineers help astronauts exercise skeletal muscles in space. They list the three types of...
Curated OER
Heredity: Your Connection To The Past
Students investigate genetics and the process of reproduction in living organisms.
Curated OER
Mathematics Within: Algebraic Patterns
Students investigate the concept of using proportions to compare quantities while also practicing calculations for foreign exchange rates. They develop the skill of solving for unknown quantities of money while using an algebraic equation.
Curated OER
Graphing Linear Equations with Calculator
Students graph lines using the calculator. In this algebra lesson, students graph lines of equations in the form y=mx+b. They input equations into the TI Calculator and graph using the slope and intercept. They analyze the graph for...
Mathematics Assessment Project
Comparing Lines and Linear Equations
Scholars first complete an assessment task on writing linear equations to model and solve a problem on a running race. They then take part in a card matching activity where they match equations and graphs of lines to diagrams of fluid...
Berkshire Museum
Where’s the Water?: Acting Out Science Cycles
Young scientists transform themselves into rivers, oceans, clouds, and drops of water in order to explore the water cycle. After assigning and explaining to students their different roles in the activity, the teacher reads aloud a...
Curated OER
A Steep Hike
Young scholars explore slope. In this middle school mathematics lesson, students analyze and interpret graphs as they investigate slope as a rate of change. Young scholars use a motion detector to collect data as they walk at different...


