PhET
Sugar and Salt Solutions
Ionic bonds form from electrostatic energy, allowing for higher conductivity than those seen in covalent bonds. In the simulation, learners add sugar and salt to water and see the effects on concentration and conductivity of their...
Chymist
The Solubility of a Salt in Water at Various Temperatures
An educational activity allows young chemists to test the solubility of different types of salt at various temperatures. Groups create a graph using data from unsaturated, saturated, and supersaturated solutions.
Curated OER
The Water Cycle
Observe the stages of the water cycle by completing 3 activities. To help understanding of the water cycle your students can observe evaporation, the formation of frost, vapor and water and the process of distillation which is used to...
Curated OER
MEASURING THE DENSITY OF WATER
Students perform an experiment to measure the density of tap water vs. salt water.
Curated OER
Earth's Water: A drop in your cup
Students complete activities where they observe the amount of freshwater in the world as a fraction of the actual amount of water using different mixtures. In this freshwater lesson plan, students brainstorm on how to preserve freshwater.
Curated OER
Is It Safe to Go In? Water Quality of Bathing Areas in the EU
Using your senses, apprehend the effects of contaminants in water. With a global focus, young scientists conduct a safe experiment by tasting sugar and salt water with different dilutions. After reviewing threshold limits, learners write...
Polar Trec
Where is the World's Water?
Scholars discover the amount of the Earth's water in various locations such as the ocean, ice, the atmosphere, etc. They then make a model of the how much water those percentages represent. Finally, analysis questions bring the concepts...
Curated OER
Where's the Water? Stream Side Science
After a whole-class discussion of water reservoirs, ten liters of water are given to each lab group to represent Earth's total amount of water. They divide the water into smaller containers, each representing one of those reservoirs. The...
Curated OER
The Effect of Dissolved Salt on the Boiling Point of Water
Explore the properties of solutions with a lab activity. Chemistry fans determine the boiling point of water, add salt to create a solution, and then repeat the process four more times. They design their own data table and then graph the...
Chymist
Testing the Waters
Should you trust the water you drink every day? The hands-on activity has scholars test water from different sources for contaminants. Pupils perform chemical testing and make conclusions about pH, hardness, iron, chlorine, lead, and...
Curated OER
Salt of the Earth: A Caddo Industry in Arkansas
Middle schoolers explore the history of the Caddo Salt Industry found in Arkansas. Along with learning about how salt deposits formed in Arkansas, learners study the process of salt production and how valuable salt is as a natural...
University of Waikato
Temperature, Salinity and Water Density
The difference between sinking and floating may be a little salt. Young experimenters analyze the effect of salt and temperature on the density of water. They use their results to predict the effect of climate change on ocean ecosystems.
Curated OER
Boiling and Freezing Points of Water
Challenge your sixth graders with this lesson about the freezing and boiling points of water. In these activities learners graph temperature data, read and analyze information, and identify the freezing and boiling points of water and...
US Geological Survey
Water, Water, Everywhere?
Less than one percent of the earth's water is available for human use. A hands-on activity models the phenomenon for young scientists. Beginning with a specific volume of water, learners remove water that correlates to the percent of...
American Chemical Society
Why Does Water Dissolve Salt?
Individuals explore solubility by modeling how water dissolves salts. They then view a video and compare how well water and alcohol dissolve salts, relating their comparisons to the structure of each molecule.
DiscoverE
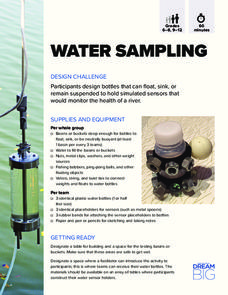
Water Sampling
What is the best way to test water quality? Using plastic bottles, scholars create monitoring sensors to test water quality. Creating three different sensors allows individuals to measure water quality at different water levels.
Curated OER
Water Pressure in the Ocean
Students compare the pressure of water at different depths and gain an understanding of how increased water might affect animals living in deeper waters. They participate in an experiment to show that depth, not volume, affects water...
Curated OER
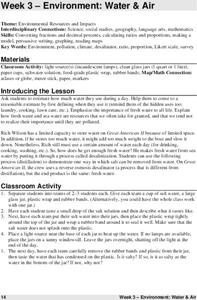
Environment: Water & Air
The introduction to the lesson mentions a sailor's limited capacity to store drinking water on his ship. Pupils then set up an overnight experiment to remove freshwater from salt water by distillation. There is a math and map activity to...
Curated OER
Salt Marsh in a Pan
Students create a model of a salt marsh to discover the impact of pollution and human activities on water-based habitats including bays and the ocean. They recognize the relationship between natural and developed areas. Students impact...
Curated OER
WET Science Lesson #5: Pass the Salt Please! (How Road Salt Affects Wetlands)
As an anticipatory set, biologists listen to the story of Ruth Patrick, a scientist who used algae to detect water quality. They observe a demonstration of osmosis and diffusion. In their lab groups, they place Elodea stalks in...
Curated OER
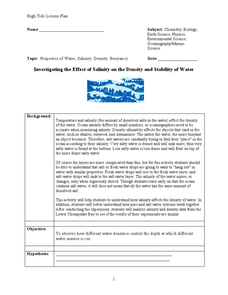
Investigating the Effect of Salinity on the Density and Stability of Water
Water with varying amounts of dissolved salt are dyed and then used to compare densities. The objective is to discover the effect of salinity, and therefore density, on ocean water on the stability of the ocean. Many branches of science...
Curated OER
How Does Water Cool?
How fast does water cool? First fifth graders will draw a line on a graph that predicts how fast they think water can cool from boiling. Then they plot the actual data on the same graph to see if their estimate was correct.
Curated OER
What Are The Properties of Sea Water?
Ninth graders conduct research on the subject of sea water. They use a variety of resources to obtain information. There are helpful resource links listed in the lesson. In conjunction with the research students make inquiry of the...
Curated OER
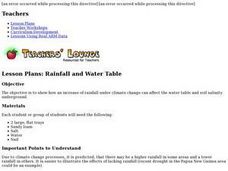
Rainfall and Water Table
Through inquiry, experimentation, and observation, young scientists see how an increase in rainfall under climate change can affect the water table and soil salinity underground. Young scientists build models that represent the...


