EngageNY
The Most Important Property of Logarithms
Won't the other properties be sad to learn that they're not the most important? The 11th installment of a 35-part module is essentially a continuation of the previous instructional activity, using logarithm tables to develop properties....
EngageNY
Estimating Centers and Interpreting the Mean as a Balance Point
How do you balance a set of data? Using a ruler and some coins, learners determine whether the balance point is always in the middle. Through class and small group discussions, they find that the mean is the the best estimate of the...
EngageNY
Conditional Relative Frequencies and Association
It is all relative, or is it all conditional? Using an exploration method, the class determines whether there is an association between gender and superpower wish through the use of calculating conditional relative frequencies. The...
EngageNY
Analyzing a Verbal Description
What function will describe the insect population growth? Pairs or small groups work together to determine which type of function and specific function will model given scenarios. The scenarios differentiate between linear,...
EngageNY
Analyzing a Data Set
Through discussions and journaling, classmates determine methods to associate types of functions with data presented in a table. Small groups then work with examples and exercises to refine their methods and find functions that work...
EngageNY
Modeling a Context from Data (part 2)
Forgive me, I regress. Building upon previous modeling activities, the class examines models using the regression function on a graphing calculator. They use the modeling process to interpret the context and to make predictions...
EngageNY
Modeling a Context from a Verbal Description (part 2)
I got a different answer, are they both correct? While working through modeling problems interpreting graphs, the question of precision is brought into the discussion. Problems are presented in which a precise answer is needed and...
EngageNY
Irrational Exponents—What are 2^√2 and 2^π?
Extend the concept of exponents to irrational numbers. In the fifth installment of a 35-part module, individuals use calculators and rational exponents to estimate the values of 2^(sqrt(2)) and 2^(pi). The final goal is to show that the...
EngageNY
Euler’s Number, e
Scholars model the height of water in a container with an exponential function and apply average rates of change to this function. The main attraction of the lesson plan is the discovery of Euler's number.
EngageNY
The “WhatPower” Function
The Function That Shall Not Be Named? The eighth installment of a 35-part module uses a WhatPower function to introduce scholars to the concept of a logarithmic function without actually naming the function. Once pupils are...
West Contra Costa Unified School District
Slope-Intercept Sort
What's so special about slope? Pupils first match cards with slope and y-intercept to graphs of linear equations. They continue the lesson by matching equations in slope-intercept form to the same graphs.
EngageNY
Special Triangles and the Unit Circle
Calculate exact trigonometric values using the angles of special right triangles. Beginning with a review of the unit circle and trigonometric functions, class members use their knowledge of special right triangles to find the value...
West Contra Costa Unified School District
Average Rate of Change
Learners investigate average rates of change for linear functions and connect the concept to slope. They then determine average rates of change in quadratic and exponential functions.
Curated OER
Systems of Linear Inequalities
Graphing systems of linear inequalities is the focus of this worksheet. Problems range from checking solutions of inequalities, graphing systems of two inequalities, and graphing systems of three inequalities. Graphing horizontal lines,...
West Contra Costa Unified School District
Graphing Systems
Get hands on with solving systems of equations graphically. A solid lesson plan uses guided practice to show how to solve systems of linear equations. It allows time for sharing ideas and provides a printable matching activity...
West Contra Costa Unified School District
Sneaking Up on Slope
Pupils determine the pattern in collinear points in order to determine the next point in a sequence. Using the definition of slope, they practice using the slope formula, and finish the activity with three different ways to...
Curated OER
Solving Equations and Formulas
Learners rearrange equations and formulas to solve for a specified variable. Includes multi-step equations with a variety of different variables and a few real-world applications. Great for use as a study guide when presenting the...
Curated OER
Quick Graphs of Linear Equations
Graph equations of lines using the slope-intercept method or by plotting both x and y intercepts. Determine if two lines are parallel or perpendicular by comparing their slopes. This handout includes step-by-step directions and four...
EngageNY
Searching a Region in the Plane
Programming a robot is a mathematical task! The activity asks learners to examine the process of programming a robot to vacuum a room. They use a coordinate plane to model the room, write equations to represent movement, determine the...
SHS Algebra
Transformations of Linear and Exponential Graphs
Your transformers will create and analyze graphs to discover which operations produce which transformations. Linear and exponential functions are used to model the transformations.
Curated OER
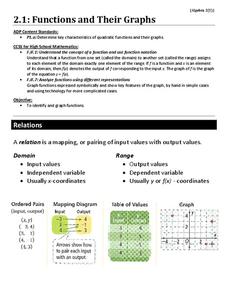
Functions and Their Graphs
Use a worksheet to go over the basic concepts of relations and functions. Included are clear definitions and examples of relations, domain and range, and functions and the vertical line test. However, the problems are pretty...
Curated OER
Solving Absolute Value Inequalities
Start this activity with a brief description of how to solve absolute value inequalities. A space is provided to help classify the inequalities into types (greater than, less than, or equal to) and for learners to show how to graph their...
Curated OER
Linear Inequalities in Two Variables
Use this worksheet as a warm up, a refresher exercise, or a practice after a more detailed lesson on graphing linear inequalities in two variables. Start with boundaries that are horizontal or vertical, then move into graphs with...
Curated OER
Solving Linear Systems Using Matrices
Start with the definition of a determinant and how to evaluate a 2x2 determinant. Apply this skill to solve systems of two equations with two unknowns by using Cramer's rule. These four basic problems would be good for a quick review or...


