Achieve
BMI Calculations
Obesity is a worldwide concern. Using survey results, learners compare local BMI statistics to celebrity BMI statistics. Scholars create box plots of the data, make observations about the shape and spread of the data, and examine the...
Education Development Center
Geography of the Coordinate Plane
Put the graph into graphing and allow learners to understand the concept of point plotting and how it relates to data. The worksheet provides a nice way to connect data analysis to a graph and make predictions. The worksheets within the...
Curated OER
It's Your Life - Safe or Sorry/Safety Issues
Students examine and chart data about safety hazards and unsafe situations. In this safety hazard lesson, students examine newspapers and web sites to investigate injuries from safety hazards. They make a spreadsheet using the data and...
Curated OER
Residential Power System
Perform data analysis on energy consumption to apply algebraic expressions to the real world. Learners will write and solve equations that answer various questions from residential power use. They will collect data at home and calculate...
Education World
The African American Population in US History
How has the African American population changed over the years? Learners use charts, statistical data, and maps to see how populations in African American communities have changed since the 1860s. Activity modifications are included to...
Howard Hughes Medical Institute
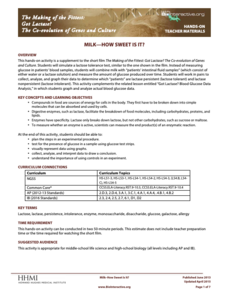
Milk—How Sweet Is It?
Have you ever wondered why some people are lactose intolerant? Participants test simulated patients in a hands-on lab activity to find out! They learn about lactose intolerance by performing an experiment, analyzing data, and drawing...
Florida Department of Health
Nutrition: Developing Healthy Habits Unit
The focus of the fourth unit in the Youth Risk Behavior Survey Curriculum is on healthy eating and exercise. Class members examine healthy habits data from the YRBD Youth Online Tool, learn about the importance of a healthy diet and...
Teach Engineering
Building-Testing-Improving Paper Airplanes: Head's Up!
Take foldables to all new heights. Pupils build and fly different types of paper airplanes in the 14th portion of a 22-part unit on aviation. Groups collect data on distance and flight time for each plane and compare the data from the...
EngageNY
Revisiting the Graphs of the Trigonometric Functions
Use the graphs of the trigonometric functions to set the stage to inverse functions. The lesson plan reviews the graphs of the basic trigonometric functions and their transformations. Pupils use their knowledge of graphing functions to...
Teach Engineering
Graphing Equations on the Cartesian Plane: Slope
Slopes are not just for skiing. Instructors introduce class members to the concept of slope and teach them how to calculate the slope from a graph or from points. The lesson plan also includes the discussion of slopes of parallel and...
Curated OER
Elastic Recoil in Arteries and Veins
A lab in which high schoolers examine the difference between arteries and veins. Budding biologists will find out which blood vessel can stretch furthest, recording their data in a table then answering several questions evaluating their...
Curated OER
Data Analysis of Ground Level Ozone
Sixth graders construct and interpret graphs from ozone data collected in Phoenix area. Can be adapted to other areas.
Curated OER
What's Up With My Class
Learners collect data about their class and they use Excel spreadsheet to display their tables and graphs about the class. They answer survey questions and collect their data. Students create a graph of their choice to display the...
Curated OER
Comparing School Bus Stats
Engage in a lesson that is about the use of statistics to examine the number of school buses used in particular states. They perform the research and record the data on the appropriate type of graph. Then they solve related word problems.
Curated OER
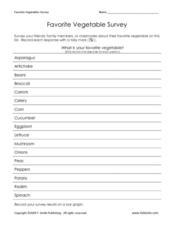
Favorite Vegetable Survey
What's your favorite? Use this chart template in your lesson on data collection and graphing. Learners record classmates' favorite vegetable in a survey, and then graph the results. A labelled graph is provided here- print both pages...
Curated OER
Fall Leaves
For this fall leaves worksheet, students identify the colors of leaves and determine the number they have of each. This worksheet may be used in elementary grades, for color identification and counting purposes. For the middle school...
Curated OER
DATA ANALYSIS OF GROUND LEVEL OZONE
Sixth graders construct and interpret graphs from ozone data collected in the Phoenix area.
Curated OER
Drug Sales Soar: Bar Graph
In this graphs worksheet, students analyze a bar graph that shows retail prescription drug sales in the U.S. Students complete five problem solving questions about the data on the graph.
Curated OER
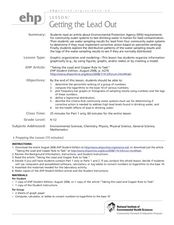
Getting the Lead Out
The article for this instructional activity no longer accessible through the links in the lesson plan, but can be found in the National Center for Biotechnology Information website. After reading it, environmental science high schoolers...
Curated OER
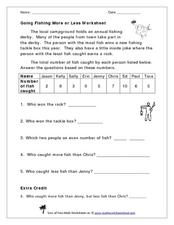
Going Fishing More or Less Worksheet
Take your class on a hypothetical fishing trip! This word problem gives a data set describing how many fish each of the nine contestants in a fishing derby caught. The numbers range from zero to ten. Learners examine the data and answer...
Curated OER
What's My Pattern?
Students recognize, describe and extend patterns in three activities. They organize data, find patterns and describe the rule for the pattern as well as use the graphing calculator to graph the data to make and test predictions. In the...
Curated OER
Graphing Data
Second graders graph data about their classmates. For this data analysis lesson, 2nd graders ask each other several questions about their hair color and eye color. Students graph the data that they collected.
Curated OER
Experiment Report
In this experimental design activity, learners fill out their title, hypothesis, independent and dependent variables, data table, graph and conclusion for their lab.
Curated OER
Look, There's Another One!
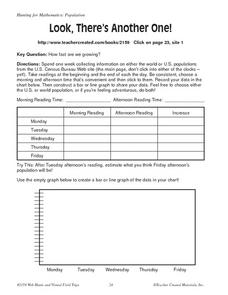
In this math worksheet, learners spend a week collecting information on either the word or U.S. populations from the U.S. Census Bureau Web site. Students record their data in a chart and bar graph. Learners also use the website to...


