CK-12 Foundation
Parallel and Skew Lines: Parallel or Not?
There's nothing askew about an informative resource. Pupils adjust one of two lines in an interactive to determine if the lines are parallel or skew. They answer a set of challenge questions about the lines.
CK-12 Foundation
Checking Solutions to Inequalities: Apples and Bananas Shopping Excursion
Go bananas over a fun interactive! Learners drag a point on a virtual graph of an inequality to see if it is a solution. This helps determine the possible numbers of apples and bananas a shopper can buy with a given amount of money.
CK-12 Foundation
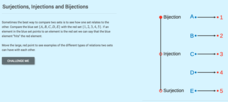
The Real Numbers: Surjections, Injections and Bijections
Inject a great interactive into your lesson plans. Scholars learn about injections, surjections, and bijections of sets. They use an interactive that shows an example for each of these relationships between sets.
CK-12 Foundation
Bar Graphs, Frequency Tables, and Histograms: Comparing Heights
Become a master at creating visual displays. Using a provided list of heights, users of the interactive create a bar graph and a histogram. They answer a set of challenge questions based on these data representations.
CK-12 Foundation
Graphs for Discrete and for Continuous Data: Discrete vs. Continuous Data
Not all data is the same. Using the interactive, pupils compare data represented in two different ways. The learners develop an understanding of the difference between discrete and continuous data and the different ways to represent each...
CK-12 Foundation
Interpretation of Circle Graphs: Northwest Region Population Pie
Given populations of the five Northwestern states, learners create a circle graph. Using the data and the pie chart, they make comparisons between the populations of the states. Finally, the pupils determine how the chart will change...
CK-12 Foundation
Types of Data Representation: Baby Due Date Histogram
Histograms are likely to give birth to a variety of conclusions. Given the likelihood a woman is to give birth after a certain number of weeks, pupils create a histogram. The scholars use the histogram to analyze the data and answer...
CK-12 Foundation
Misleading Graphs (Identify Misleading Statistics): Are Virgos Cursed?
Is it safe to take data at its face value? Pupils use the interactive to evaluate a claim that Virgos are more likely to get into a car crash than others. Individuals determine whether another variable may be at play.
CK-12 Foundation
Multiple Bar Graphs
I scream, you scream, we all scream for ice cream bar graphs. Pupils create a multiple bar chart to represent the sales of ice cream products during the first week of summer. Using the chart, learners find the day that each of the...
CK-12 Foundation
Understand and Create Histograms: Car Sales
Create a history of car sales. Pupils create a histogram/bar graph to show the number of car sales made during the week. Using the data display, learners calculate numerical summaries of the data and find the percent of cars sold during...
CK-12 Foundation
Understand and Create Histograms: Histograms
Determine the shape of weight. Using the interactive, class members build a histogram displaying weight ranges collected in a P.E. class. Scholars describe the shape of the histogram and determine which measure of central tendency to use...
CK-12 Foundation
Frequency Polygons: Constructing a Frequency Polygon
Connect the dots on frequency. Given a distribution table of scores on an assessment, learners create a frequency polygon by moving points on a graph to the correct frequency. The pupils use the display to answer questions about the...
CK-12 Foundation
Broken-Line Graphs: Heating Curve of Water
Examine the unique graphs coined broken-line graphs. Using the phase change of water for data, learners answer questions related to the temperature and energy at different times in the cycle of the phase change. Questions focus on the...
CK-12 Foundation
Formulas for Problem Solving: Finding Distance, Rate, and Time
Go the distance in learning about distance, rate, and time. Young mathematicians use an interactive to investigate the relationship between distance, rate, and time. A set of challenge questions assesses understanding of these...
CK-12 Foundation
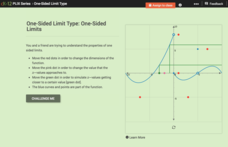
One-Sided Limit Type: One-Sided Limits
Not everything that's one-sided is bad. A slider interactive aids learners in investigating one-sided limits from graphs. A set of challenge questions assesses their understanding of the relationship between one- and two-sided limits.
CK-12 Foundation
Restricted Domain and Range: Translation of a Curve
Moving the graph of a function obviously changes its domain and range. Scholars adjust the location of a graph in an interactive coordinate plane. The interactive automatically updates and displays the domain and range to show how it...
CK-12 Foundation
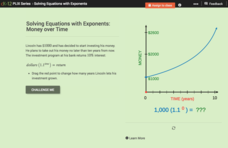
Solving Equations with Exponents: Money Over Time
We'd all like to see our money double. An interactive shows how an initial investment of $1,000 will increase using a constant rate of return. Scholars answer a set of challenge questions based on the situation.
CK-12 Foundation
Continuous Interest
Continue teaching your financial scholars about interest. A slider interactive has users investigate the growth of an account earning continuous interest. A set of challenge questions has them solve problems given a variety of situations.
CK-12 Foundation
APR and APY: APR vs. APY
Who wins the battle of the interest rates? Scholars use an interactive to investigate three different bank rates. Comparing APR and APY lets them see how nominal and effective rates differ.
CK-12 Foundation
Even and Odd Functions and Function Symmetry: Even and Odd Functions (Symmetry)
Even money states that the resource is good to use. Scholars manipulate an interactive to adjust the portion of a graph to the left of the y-axis. The interactive allows them to switch between even and odd modes that show the right side...
CK-12 Foundation
Find Imaginary Solutions: Imaginary Zeros
The resource is the real deal. Individuals investigate the imaginary zeros of f(x) = x^2 + 1. They accomplish this task by using an interactive that shows input values x = a + bi and output values x^2 + 1 on a complex plane.
CK-12 Foundation
Concept of Limit: Limit Notation
Limits to infinity are simple to find if you can compare numerators and denominators. Users of the interactive drag expressions to match with their limit as x approaches infinity. A set of challenge questions assesses their groupings.
CK-12 Foundation
Mode: Kittens
It is not as difficult as herding cats. The short interactive provides a group of kittens to sort according to their colors. Pupils determine the mode of the number of kittens by color. The questions continue with other numbers of...
CK-12 Foundation
Mode: Mucho Money
Generate stacks of money. Given bills of different denominations, pupils stack them based on their values. The learners figure out which value is the mode of the data and determine whether the data is unimodal, bimodal, or multimodal.
Other popular searches
- Basic Math Skills Pretest
- Basic Math Skills Test
- Basic Math Skills Inventory
- Basic Math Skills Review
- Basic Math Skills Activities
- Math Basic Skills
- Cumulative Basic Math Skills
- Prue Test Basic Math Skills
- Pre Test Basic Math Skills
- Basic Math Skills Pretest"
- Basic Skills Math Games
- Basic Math Skills Pretest"+


