Balanced Assessment
On Averages and Curves
Determine the average on a curve. The class finds graphical representations of averages and expresses them both symbolically and on the graph. The assessment requires class members to justify using average to describe graphs.
Curated OER
Exponential Reflections
High Schoolers explore the concept of exponential reflections. They use their Ti-Nspire to reflect the natural logarithm function over the line y=x. Students repeat the process using different exponential functions using a slider.
EngageNY
Motion Along a Line – Search Robots Again
We can mathematically model the path of a robot. Learners use parametric equations to find the location of a robot at a given time. They compare the paths of multiple robots looking for parallel and perpendicular relationships and...
Curated OER
Long Day?
Middle schoolers become aware of the effects of tides on the Earth's rotation. In this tides lesson, students calculate the number of seconds lost over various periods of time.
The New York Times
Understanding the Mathematics of the Fiscal Cliff
What exactly is the fiscal cliff? What are the effects of changing income tax rates and payroll tax rates? Your learners will begin by reading news articles and examining graphs illustrating the "Bush tax cuts" of 2001 and 2003. They...
Curated OER
In the Billions and Exponential Modeling
Modeling population growth gives learners an opportunity to experiment with real data. Comparing the growth rates in this real-life task strengthens learners' understanding that exponential functions change by equal factors over equal...
Bowland
Cats and Kittens
Can a cat have 2,000 descendants in 18 months? To determine if this claim is realistic, individuals must take different pieces of information into account when justifying their responses.
Curated OER
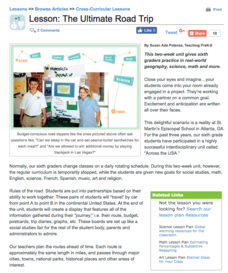
The Ultimate Road Trip
Sixth graders experience and practice real-world geography, science and math as they imagine planning out the ultimate road trip. They set goals and maintain a daily budget as they are given a set of rules as they plan their road trip...
Curated OER
Investigation--Can You Build This?
Early learners explore shapes using colored blocks. They first get some hands-on time with the blocks and then look at beginning math concepts regarding spatial relationships. They work with a partner to build a 6-8 block tower with...
Math Worksheets Land
Probability of Chance Events - Guided Lesson
Show learners that their choices can change based on probability. The lesson discusses the idea of theoretical and experimental probability when choosing items or flipping a coin. Use the page with the additional resources provided for a...
Curated OER
Five by Two
Help young mathematicians read and interpret numbers from 1 to 10 and sequence them correctly with this card game. Using a deck of cards and two to three classmates, have one player hand out ten cards to each gamer and then put the extra...
Curated OER
Bowling Over Fractions
Stduents use fractions by bowling. They are required to make a math sentence after bowling and using greater than, less than or equal signs.
Curated OER
All About Trees
Second graders examine the artwork of Robert Harris and discuss how trees are an important part of their lives. In groups, they discover how people's use of the environment has changed over time and describe the climate and vegetation...
Curated OER
Population Models and Qualitative Analysis, Part 2
For this population model worksheet, students explore models of population growth using the Gompertz growth model and the exponential growth model. They sketch a graph of the slope function and determine possible solutions over time....
Curated OER
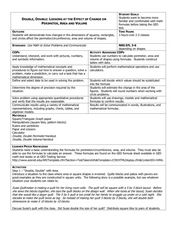
Double, Double: Looking at the Effect of Change on Perimeter, Area and Volume
Students explore perimeter, volume, and area. In this math lesson, students explore how changes in dimensions of geometric shapes affect the perimeter, area and volume of the various shapes. Students investigate the results when the...
Curated OER
Data Analysis, Probability, and Discrete Math: Line Graphs
Eighth graders analyze data from line graphs. They discuss the purpose of line graphs, identify the parts of a line graph, answer questions about various graphs, and complete a worksheet. This lesson includes a script to teach along with.
Wild BC
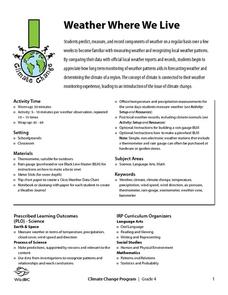
Weather Where We Live
Over a span of two weeks or more, mini meteorologists record weather-related measurements. What makes this particular resource different from others covering similar activities are the thorough details for the teacher and printables for...
EngageNY
Constant Rates Revisited
Find the faster rate. The resource tasks the class to compare proportional relationships represented in different ways. Pupils find the slope of the proportional relationships to determine the constant rates. They then analyze the rates...
District 158
Plan an Adventure
For kids, taking a vacation is all fun and games, but after completing this pre-algebra project, they'll have a whole new appreciation for the planning that makes these trips possible. Given a budget of $5,000 to spend on purchasing the...
University of Connecticut
Weather Vs. Whether
Monarch butterfly populations have decreased by 90 percent over the past 20 years due to misuse and ineffectiveness of some pesticides. Given the challenge to increase pesticide safety and effectiveness, the class, through discussion,...
Curated OER
Revolutionary Money
Examine paper money from the American revolution! Historians study the paper bills and discuss the history of money. How has money changed over the times? Activities are included.
Visa
Financial Forces: Understanding Taxes and Inflation
Take the opportunity to offer your young adults some important financial wisdom on the way taxes and inflation will affect their lives in the future. Through discussion and review of different real-world scenarios provided in this...
Curated OER
Practice with Euler's Method
In this Euler's Method worksheet, students determine the rate of change in given functions They use Euler's Method to approximate the solution of an equation. This two-page worksheet contains approximately twenty problems.
Curated OER
Population Models and Qualitative Analysis
In this quantitative analysis worksheet, students explore the limits of a rate equation. They use quantitative analysis methods to determine the differential, plot graphs of their values, and describe the relationships between the...


