PBS
Hands-On Engineering Challenges to Bolster Your Electricity, Sound, and Force Units
Need some activities to go along with your unit? A collection of hands-on activities from PBS offers opportunities to add to your electricity, sound, and force units. The electricity activities revolve around building a...
Wells Fargo
Hands on Banking
Encourage middle schoolers to be proficient and knowledgeable in the economic world with a series of personal finance lessons. Focusing on banking, credit, budgets, and investing, the activities guide learners through financial...
Curated OER
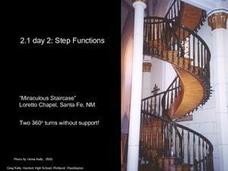
Calculus 2.1 day 2 - Step Functions
"Step functions" are sometimes used to describe real-life situations. This extensive lesson with many practice examples demonstrates two such functions: the Greatest Integer Function and the Least Integer Function. The commands on the...
EngageNY
First-Person Computer Games
How do graphic designers project three-dimensional images onto two-dimensional spaces? Scholars connect their learning of matrix transformations to graphic design. They understand how to apply matrix transformations to make...
Illustrative Mathematics
Christina's Candies
Help Christina figure out how many chocolate and lemon candies she has with a instructional activity on decomposing numbers. When presenting this context to the class, the teacher chooses the total number of candies and the number that...
Curated OER
Fraction Problem Solving Process
Help your charges solve a variety of fraction and skip counting problems using a problem solving process. As a class they work through a fraction problem step-by-step, and discuss a real-life connection to the problem. Students then play...
Illustrative Mathematics
Telling a Story With Graphs
Turn your algebra learners into meteorologists. Students are given three graphs that contain information about the weather in Santa Rosa, California during the month of February, 2012. Graph one shows temperatures, graph two displays the...
Willow Tree
Slope
Investigate the different types of slope using graphs and ordered pairs. Scholars use the slope formula to determine the slope of a line between two points. Includes examples with a slope of zero and with no slope. The lesson follows a...
EngageNY
Making Scale Drawings Using the Ratio Method
Is that drawn to scale? Capture the artistry of geometry using the ratio method to create dilations. Mathematicians use a center and ratio to create a scaled drawing. They then use a ruler and protractor to verify measurements.
Willow Tree
Scientific Notation
Numbers that are very large or very small are difficult to express in standard notation. Pupils learn how to convert between standard and scientific notation. They also multiply and divide the numbers in scientific notation.
Mathematics Vision Project
Module 7: Trigonometric Functions, Equations, and Identities
Show your class that trigonometric functions have characteristics of their own. A resource explores the features of trigonometric functions. Learners then connect those concepts to inverse trigonometric functions and trigonometric...
Curated OER
Area
Third graders find areas of rectangles by using square units, apply knowledge to real-life situations, and simplify method of counting square units by multiplying the length times the width.
Curated OER
Gravity, Angles, and Measurement
Students relate math to real life scenarios. In this geometry lesson, students launch a ball tracking each launch using a graph. They analyze their data for speed, angles and distance, trying to improve on each launch.
Curated OER
A Real Life Example of the Distance Formula
Students answer the following question: "Using the lines of latitude and longitude, what is the distance (in degrees) if you were to travel from NASA Dryden to NASA Ames?" They use the distance formula to find the distance (measured in...
Curated OER
Making Connections: Matrices, Graph, Linear Systems
In this set of activities, matrices and equations are explored. They work with matrices using pen and paper as well as graphing calculator. Additionally real-world problems are explored.
EngageNY
Modeling a Context from Data (part 1)
While creating models from data, pupils make decisions about precision. Exercises are provided that require linear, quadratic, or exponential models based upon the desired precision.
Virginia Department of Education
Analyzing and Interpreting Statistics
Use measures of variance to compare and analyze data sets. Pupils match histograms of data sets to their respective statistical measures. They then use calculated statistics to further analyze groups of data and use the results to make...
Mathematics Vision Project
Probability
Probability, especially conditional probability, can be a slippery concept for young statisticians. Statements that seem self-evident on the surface often require a daunting amount of calculations to explicate, or turn out to be...
Curated OER
Measurement and Conversion of Units in a Recipe
In a cross-curricular measurement and literacy lesson, your class will identify and compare cooking measurement instruments. They read a recipe and sequence a set of similar instructions in which the steps have been mixed up....
CK-12 Foundation
Area and Volume of Similar Solids: Similar Solids
Five questions make up an interactive designed to boosts knowledge of area and volume of solid figures. Question types include multiple-choice, true or false, and fill-in-the-blank. A scale model changes measurement to provide a visual...
Curated OER
The Notorious Four-Color Problem
Take a walk through time, 1852 to 2005, following the mathematical history, development, and solution of the Four-Color Theorem. Learners take on the role of cartographers to study a United States map that is to be...
Curated OER
Math and Your Local Restaurant
Connect ratios, fractions, scale factor, percents, and elapsed time to restaurants.
Curated OER
Fractions XIII - Multiplication of Whole Numbers
In this math PowerPoint, the process of multiplying whole numbers and fractions is broken down into clear, sequential steps. Examples of each step are given numerically and in simple, easy-to-understand text. Story problems and examples...
Curated OER
Real Life Graphs
For this real life graphs worksheet, students examine graphs and determine the equation of a line. They interpret distance time graphs and draw graphs to match a real life situations. This three-page worksheet contains 3 multi-step...


