Curated OER
Linear Inequalities
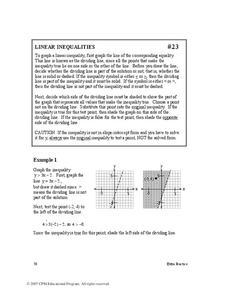
In this linear inequalities worksheet, students solve and graph systems of inequalities on a coordinate plane. Examples and explanations are provided. This five-page worksheet contains 32 problems. Answers are provided at the end of...
Curated OER
Geometry and Geoboard
Sixth graders use geoboards and dot paper to experiment with geometric concepts. In this geometry instructional activity, 6th graders complete four activities using geoboards or dot paper including naming points on a coordinate plan and...
Curated OER
Transformations in the Coordinate Plane: Reteach
In this transformations worksheet, students review the terms and example diagrams for a translation, reflection, and rotation. Students then identify the coordinates for a triangle after completing the given transformations in the four...
Curated OER
Graph Functions: Practice
In this graph functions worksheet, students complete several activities to help them graph functions. Students use the table and the graph to complete the questions. Students also answer two test prep questions.
Curated OER
Graphing and the Coordinate Plane
Students gain practice reading coordinates and plotting points by participating in the Coordinates! Game. They demonstrate and test their skills with graph paper and the Maze Game.
Curated OER
Graphing Ordered Pairs
Seventh graders investigate the concept of ordered pairs as found in Algebra. They are introduced to the data set that corresponds to the coordinate system. Also students practice the graphing the ordered pairs using the x and y axis.
Curated OER
Graphs of Quadratic Equations
In this math worksheet, students solve the problems that ask for the graph of the parabola. They interpret the quadratic equation for its solutions.
Curated OER
Graphs of Quadratic Functions Section 11.6
In this graphing worksheet, learners graph quadratic functions. They identify the maximum and minimum value of the function, determine the line of symmetry, and locate the vertex. Coordinate planes are provided for each function. There...
Virginia Department of Education
What's the Point?
Point your class in the right direction in plotting points with three activities that give scholars a chance to learn about and practice plotting points on a coordinate plane. They draw figures on the coordinate plane and list out the...
Mathematics Vision Project
Module 2: Systems of Equations and Inequalities
The brother-sister pair Carlos and Clarita need your class's help in developing their new pet sitting business. Through a variety of scenarios and concerns presented to the siblings, the learners thoroughly explore systems of equations...
Mathematics Vision Project
Connecting Algebra and Geometry
Connect algebra and geometry on the coordinate plane. The eighth unit in a nine-part integrated course has pupils develop the distance formula from the Pythagorean Theorem. Scholars prove geometric theorems using coordinates including...
Inside Mathematics
Aaron's Designs
Working with transformations allows the class to take a turn for the better. The short assessment has class members perform transformations on the coordinate plane. The translations, reflections, and rotations create pattern designs on...
Mathematics Assessment Project
Representing Inequalities Graphically
A new, improved version of the game Battleship? Learners graph linear inequalities on the coordinate plane, then participate in a game where they have to guess coordinate points based on the solution to a system of linear inequalities in...
Mathematics Assessment Project
Classifying Equations of Parallel and Perpendicular Lines
Parallel parking might be difficult, but finding parallel lines is fairly simple. In this lesson, learners first complete an assessment task involving parallel and perpendicular lines in the coordinate plane. Individuals then take part...
Achieve
Rabbit Food
Keep your pets slim, trim, and healthy using mathematics! Pupils use a linear programming model to optimize the amount and type of food to provide to a pet rabbit. They model constraints by graphing inequalities and use them to analyze a...
Shodor Education Foundation
Scatter Plot
What is the relationship between two variables? Groups work together to gather data on arm spans and height. Using the interactive, learners plot the bivariate data, labeling the axes and the graph. The resource allows scholars to create...
Curated OER
Famous People: Teacher Notes
Young statisticians practice creating scatter plots. First, they estimate the age of 14 people. Next, they write down the estimate in a table labeled x. Then write down their actual age in the table labeled y. Using these x and y...
MARS, Shell Center, University of Nottingham
Defining Regions Using Inequalities
Your young graphers will collaboratively play their way to a better understanding of the solution set produced by the combining of inequalities. Cooperation and communication are emphasized by the teacher asking questions to guide the...
Pennsylvania Department of Education
Using the Coordinate Plane in Problem Solving
Fifth graders practice solving problems. In this fraction and decimal lesson plan, 5th graders recognize the relationship between fraction and decimals. Students estimate problem results and write expressions to use for problem solving.
Curated OER
Graph Linear Inequalities
In this algebra worksheet, students solve linear inequalities and graph their results on a coordinate plane. They shade the correct side of the line. There are 8 questions with an answer key.
Curated OER
Writing and Graphing Functions
Students explore mathematics by completing a graphing assignment in class. In this math functions lesson, students practice graphing X and Y coordinates on a graph and checking their work with partners. Students complete more graphing...
Curated OER
Applications of Properties of Quadrilaterals in the Coordinate Plane
Students explore the concept of quadrilaterals. In this quadrilaterals instructional activity, students use the slope formula, midpoint formula, and distance formula to justify that a given quadrilateral is a parallelogram.
Curated OER
Impossible Graphs
Students distinguish between possible and impossible graphs of functions, and to learn why some graphs are impossible. They have practiced plotting functions on the Cartesian coordinate plane
Curated OER
XY Graph
In this math worksheet, students practice graphing ordered pairs, linear equations, or quadratic equations using this graph with the x and y axis.


