Curated OER
Graphs of Quadratic Functions Section 11.6
In this graphing worksheet, students graph quadratic functions. They identify the maximum and minimum value of the function, determine the line of symmetry, and locate the vertex. Coordinate planes are provided for each function. There...
Curated OER
Parabolas
In this parabolas worksheet, 11th graders solve and complete 12 different problems. First, they use the graph to write the equation of each parabola. Then, students name the vertex for each and write their responses on the line provided.
EngageNY
Motion Along a Line – Search Robots Again
We can mathematically model the path of a robot. Learners use parametric equations to find the location of a robot at a given time. They compare the paths of multiple robots looking for parallel and perpendicular relationships and...
02 x 02 Worksheets
Slope
What does slope have to do with lines? Pupils work with lines and determine the slope of the lines informally and with the slope formula. Groups use their knowledge to calculate the slopes of parallel and perpendicular lines. They also...
Curated OER
Take Home Question – Chapter 4
For this graphing linear equations worksheet, high schoolers solve 8 short answer and graphing problems. Students graph linear equations, find their points of intersection, find the slope of each line, identify the constructed...
Curated OER
Geometry: Parallel and Perpendicular Lines
This basic handout would be good for skills practice or a review of parallel and perpendicular lines. Review the definitions, then practice writing equations of lines that pass through a specific point and are either parallel or...
Virginia Department of Education
Inequalities
Compare graphing an inequality in one variable on a number line to graphing an inequality in two variables on a coordinate plane. Young mathematicians work on a puzzle matching inequalities and their solutions. They then complete a...
Illustrative Mathematics
Coffee by the Pound
This is a great exercise in graphing proportional quantities to interpret the unit rate as the slope of a graph. It is not easy for learners to understand what a unit rate is. When it is presented as the slope of a linear line graph,...
Curated OER
Quadrants
In this quadrants worksheet, 10th graders solve and graph 6 different graphs that contain four different quadrants. They name the quadrant or on which axis the point lies. Students identify the difference between graphing positive and...
Curated OER
Coordinates and Equations
In this algebra worksheet, students solve linear equations and plot their results on the coordinate plane. There are 20 problems using slopes and intercepts to help graph linear equations.
Illustrative Mathematics
Walk-a-thon 1
Your mathematician's job is to explore the relationship between hours and miles walked during a walk-a-thon. The activity compels your learners to experiment with different means in finding out this proportional relationship. The answer...
CCSS Math Activities
Social Security Trust Fund
Will Social Security still be around when you retire? Given data on the predicted balance of the social security fund over time, scholars plot the points on a coordinate grid and determine if a quadratic regression fits the data. They...
Curated OER
Writing Linear Equations
In this linear equations worksheet, students observe a graphed line on a coordinate plane. From their observations, they write the slope-intercept form of the equation of the depicted line. This four page worksheet contains eight...
Curated OER
Algebra II Test
In this algebra test, students must determine 3 definitions, match 4 equations to the answer, 4 short answer, and graph 4 points on a coordinate plane. There are 20 questions total.
Curated OER
Coordinates Graphing
In this geometry worksheet, students are given points to plot on a coordinate plane. They identify plotted coordinate pairs. There are 10 questions.
Curated OER
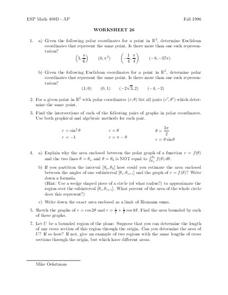
Worksheet 26
In this math worksheet, students use the polar coordinates to find the Euclidian coordinates. Then they compare points on the coordinate plane.
Curated OER
Battle Ship
In this coordinate plane worksheet, 10th graders solve and graph 3 different problems that include playing a game with graphing. First, they mark one of each of they ships either horizontally or vertically. Then, students call out a...
Curated OER
Plotting Coordinates on a Grid
In this plotting points on a graph activity, students plot 6 points on 6 graphs. Students plot x and y-coordinates in the first quadrant.
Curated OER
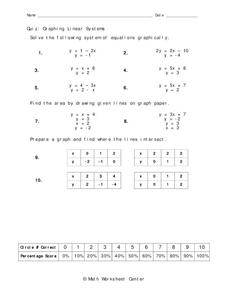
Graphing Linear Equations
In this graphing worksheet, students solve systems of linear equations by graphing on a coordinate plane. Given specific coordinates, students determine the line of intersection. This one-page worksheet contains ten problems.
EngageNY
Geometric Interpretations of the Solutions of a Linear System
An intersection is more than just the point where lines intersect; explain this and the meaning of the intersection to your class. The 26th segment in a 33-part series uses graphing to solve systems of equations. Pupils graph linear...
Willow Tree
Systems of Equations
Now that learners figured out how to solve for one variable, why not add another? The lesson demonstrates, through examples, how to solve a linear system using graphing, substitution, and elimination.
Charleston School District
Review Unit 4: Linear Functions
It's time to show what they know! An assessment review concludes a five-part series about linear functions. It covers all concepts featured throughout the unit, including linear equations, graphs, tables, and problem solving.
MARS, Shell Center, University of Nottingham
Defining Regions Using Inequalities
Your young graphers will collaboratively play their way to a better understanding of the solution set produced by the combining of inequalities. Cooperation and communication are emphasized by the teacher asking questions to guide the...
Curated OER
Spaghetti Bridges: Student Worksheet
In this math worksheet, students will create a "bridge" out of spaghetti and test it's strength with pennies. Students will record their results on a table and then graph the results.


