Cornell University
Sometimes You Behave Like a WAVE, Sometimes You Don't!
Electromagnetic radiation behaves like both a wave and a particle. Help classes explore this concept through a lab investigation. Young scientists create optical interference patterns on a glass slide using a carbon layer. They analyze...
Curated OER
Test-Driving Computers
A new form of standardized testing? Learners evaluate arguments for and against the use of computer-based standardized tests in schools. They express their views through discussion and explore the views of others through the creation and...
Curated OER
Nous Nous Souvenons: French-Canadians
Students research the French-Canadian influence in northern New York. They interview families of French-Canadian descent, research immigration history, visit a French restaurant, write narratives about their experiences interviewing...
California Department of Education
Me and My Career
Your career search starts here! Sixth grade scholars begin their journey toward college and career readiness in the first of a five-part series of lessons. Individuals identify where their interests lead them using the Holland code, then...
Curated OER
Environmental Agents of Mathematics: Mathematics for Change
High schoolers analyze environmental science data using Math. They do research about renewable energy, gather data, create graphs and interpret their findings. Then the group presents their arguments persuasively using their findings to...
Curated OER
Build Your Dream Science Lab
Would your ideal science lab be filled with bubbling beakers and zapping Tesla coils? Or would it contain state-of-the-art computer technology and data analysis? Dream big with an innovative lesson that connects math and language arts...
Curated OER
Visiting Tokyo Disneyland
Students plan a trip to Disneyland in Tokyo. They read the read the research website in Japanese and create a poster in katakana.
Code.org
Cleaning Data
"Clean the data!" "I did not know it was dirty." Introduce your class to the process of cleaning data so that it can analyze it. Groups work through a guide that demonstrates the common ways to filter and sort data. Pairs then...
Curated OER
Earthquakes: Kindergarten Lesson Plans and Activities
Beginning with a pre-lab, kindergarteners trace the letters in the word earthquake and discuss what happens in an earthquake. The lab portion allows young scientists realize that earthquakes trigger shaking of different intensities...
The New York Times
Making Do: Learning and Growing Through Adversity
What is it that makes people keep going when they face challenges in life? Ask your class to consider this question in relation to their own experiences and as they read material from The New York Times. Using personal experiences and...
University of California
Seasons Lab Book
Unlock the mystery behind seasonal change with a collection of worksheets and activities. Whether they are drawing pictures of Earth's orbit around the sun or graphing the temperature and daylight hours of different locations from around...
Curated OER
Button Bonanza
Collections of data represented in stem and leaf plots are organized by young statisticians as they embark some math engaging activities.
Curated OER
Candy Bars
There is often more to data than meets the eye. Scholars learn that they need to analyze data before making conclusions as they look at data that describes the number of candy bars boys and girls eat. They disprove a given conclusion and...
EngageNY
Cones and Spheres
Explore methods for finding the volume of different three-dimensional figures. The 20th instructional activity in the 25-part series asks learners to interpret diagrams of 3-D figures and use formulas to determine volume. Scholars must...
K12 Reader
Comparative & Superlative Practice
When should you use more and most when writing adverbs? Practice comparative and superlative adverbs with a review worksheet. After reading through the information at the top of the page, kids decide if they should use the comparative or...
Mathematics Vision Project
Probability
Probability, especially conditional probability, can be a slippery concept for young statisticians. Statements that seem self-evident on the surface often require a daunting amount of calculations to explicate, or turn out to be not so...
Curated OER
A Picture is Worth a Thousand Words
Sixth graders work to write questions for a class survey. In this survey lesson plan, 6th graders survey their class members by asking the 4 questions they developed and will record their answers on the culminating assessment provided by...
Curated OER
Great Mail Race Survey
Students participate in The Great Mail Race by choosing a state, and then choosing a town in that state. They use the Internet to find the state's postal code and the zip code for the town they chose. They design a class survey that will...
Curated OER
Why do people write?
Students brainstorm how and why people use writing in their
everyday lives and record answers on chart paper. They create a survey of questions in the computer lab then chart the responses they received from the survey then discuss the...
Curated OER
How to Construct and Conduct Successful Interviews
Students conduct surveys to gain statistical information. They examine the four main types of surveys and three types of samples. Students create a practice survey, conduct field studies, and create a survey for their hometown. Students...
Curated OER
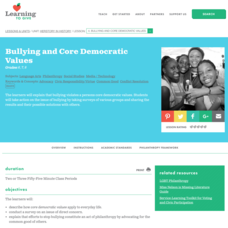
Bullying and Core Democratic Values
Middle schoolers explore the concept of core democratic values. After completing a survey of student populations regarding bullying, small groups analyze their findings and present their findings to the Student Council, principal, or the...
Curated OER
Who Am I? - Brainstorming
Students brainstorm lists of places, events and relationships that define them. They search for clip art and pictures in magazines to illustrate the items on their list and create a graphic timeline of their lives.
Curated OER
Education for Global Peace
Students survey the class and graph the results. In this graphing and data collection lesson, students conduct a survey to see where their shirts were produced. Individuals use software to graph the results and create a written...
Curated OER
Data Collection - Primary Poster
Students explore the concept of collecting, analyzing, and graphing data. In this collecting, analyzing, and graphing data lesson, students create a survey about a topic of interest. Students poll their classmates, analyze, and graph...


