Curated OER
What's Your Favorite Planet?
Fourth graders interpret a graph and make correlations using data. After taking a class survey, 4th graders create a class graph of their favorite planets. Working in small groups, they interpret the information and create at least ten...
Curated OER
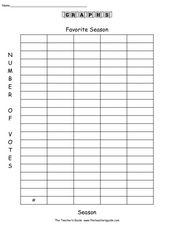
Favorite Season
In this graphing worksheet, students conduct a survey of people's favorite survey. They then complete 8 questions about the data gathered before creating a bar graph and pictograph on templates.
Curated OER
Diagnosing Allergies Through Data Collection
Students research and organize information about allergies. In this data collection lesson, students watch a video about allergies. Students create a histogram using the information collected. Students complete the 'Displaying Survey...
Curated OER
The Great Mail Race
Students explore the art of letter writing. In this writing skills lesson, students examine the format of friendly letters and business letters. Students create mail race surveys and practice writing letters according to the formats...
Curated OER
Making Graphs
Students explore statistics by conducting class demographic surveys. In this graph making activity, students identify the family members of each classmate, pets they own, and favorite activities. Students organize their statistics and...
Curated OER
Picasso Portraits
Students investigate the style of art known as cubism. They study Picasso and create a cubism portrait. Students work in partners to survey the basic symmetry of the face and head. They research the progression into cubism that Picasso...
Curated OER
Amazing Ads
In this science project worksheet, students name the product and company associated with each famous ad slogan listed. Then they survey the media to locate examples of each technique described in the boxes. Students also create a new...
Curated OER
What Is Hot?
Students explore why: Schools are hotbeds of popular young opinion about what to wear, which music to listen to, and what TV shows to watch. In this activity, students extend their fascination with "what's hot" to the books they read by...
Curated OER
What Toothpaste Do You Use?
Young scholars collect data about their favorite toothpaste and then graph the results of that data. They survey 15 of their friends to determine which toothpaste they use the most often and then color the graph to reflect the survey...
Curated OER
Youth Engagement in Politics and Government
Students gain knowledge of government representatives, political parties, and the democratic process.
Curated OER
Collecting Data and Graphing
Eighth graders, in groups, count the different colors of M&M's in each kind of package and then draw a pictograph to show the results. Each group writes a program to show their results and then compare the manually-drawn and computer...
Curated OER
What Do You Think About Radon?
Students complete a survey about radon in their homes. They calculate the averages for each question. They graph the averages and discuss the results.
Curated OER
Rodeo Round-Up
First graders create a graph of the various teachers' favorite events at the rodeo.
Curated OER
Qualitative and Quantitative Data
Seventh graders study the different ways that they have been evaluated over the years. In this qualitative and quantitative instructional activity students complete a learning activity while in groups.
Curated OER
Probability or Ability?
Pupils use their non-dominant hand to catch candy which they tossed in the air. They estimate how many they catch in a second round. They record and determine how the probability changed the second time.
Curated OER
Lesson: Journey of a Tree
Third graders explore the operation of a Christmas farm and how trees are shipped. After taking a tour of a Christmas tree farm and researching transportation, location and cost issues, 3rd graders create a map to show the distribution...
Curated OER
Fish Workings
Learners observe, hypothesize, and draw conclusions regarding fish. They examine their anatomy, and how they function in their environment.
Curated OER
Rainy Day Hike
Students develop awareness about the water cycles. They identify the watershed in which their school is located. They explain the role the schoolyard plays in the watershed.
Curated OER
Elder Migration: Grandparents and Where They Live Lesson Plan
Students examine how migration affects population change. In groups, they create a list of reasons why adults change residences and research migratory patterns among older adults. They explain the effects of migration of senior members...
Curated OER
Dishing the Dirt Part 1
Students create a soil center on their school grounds. They begin to write in their science journals. They participate in an experiment that helps the community begin their own gardens.
Curated OER
Taking a Stand on Bullying
Middle schoolers stand up against bullying in a character-building instructional activity. After discussing historical figures who became advocates in times of adversity, they brainstorm ways to end bullying at their own school, and use...
Curated OER
Unit 2: Lesson 7
Students are introduced to spreadsheets. They conduct a survey of television viewing time of different shows based on different age categories. Students work in small groups. They collect, data and interpret the data from a survey.
Curated OER
Our Favorite Season Lesson Plan
Fifth graders complete a survey about their favorite season of the year. Using Excel, they create a graph using the chart wizard and copy it into Microsoft Word. They explore the relationship between the survey and the bar graph.
Curated OER
Balloon Graphing
Fourth graders explore data, charts and graphs. They create graphs using titles, labels, axes, intervals, and scale correctly. Students enter their data into Excel and create a graph.


