CK-12 Foundation
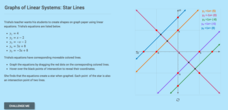
Graphs of Linear Systems: Star Lines
Let the class stars shine. Using four given linear equations, scholars create a graph of a star. The pupils use the interactive to graph the linear systems and determine the points of intersection. Through the activity, classmates...
CK-12 Foundation
Graphs of Systems of Linear Inequalities in Two Variables: President Jefferson's Octagonal Home
Mathematically complete a set of blueprints. Using eight linear inequalities, pupils create a blueprint of Thomas Jefferson's home. Individuals graph the linear inequalities and position the solution of the inequalities before...
CK-12 Foundation
Vectors as Directed Line Segments: Directed Line Segment
Direct your class' attention to directed line segments. The interactive resource allows pupils to create segments with specific endpoints. Scholars plot the initial and terminal points to determine the direction and magnitude of the...
CK-12 Foundation
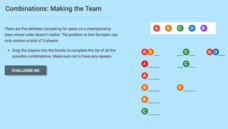
Combinations: Making the Team
Determine how many three-player teams you can make from five players. Pupils drag dots representing players to create a list of teams they can form with a limited number of players. They then find out the number of teams one individual...
CK-12 Foundation
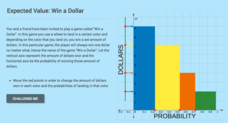
Expected Value: Win a Dollar
Spin a wheel, land on a color ... and win. Learners create a graph to display the probabilities of the amount of money they can win by spinning a colored wheel. The pupils use the dollar amounts and their probabilities to calculate the...
CK-12 Foundation
Numerical Computations: Counting Out Probability
Keep your heads up while counting. Pupils use an interactive to create a table with the possible outcomes of flipping three coins and then determine the probabilities of getting certain combinations of heads and tails.
CK-12 Foundation
Atoms to Molecules: Constructing Helium
Protons and neutrons and electrons, oh my! Physical science scholars get hands-on with interactive atomic modeling. Starting with a simple helium atom, participants create and name ions, then build isotopes. Questions throughout the...
CK-12 Foundation
Sedimentary Rock Classification: How Old is That Layer?
A timely resource illustrates the effects of the passing years on sedimentary rock formation! Young geologists discover just how long it takes to create shale, slate, and other sedimentary rocks. The interactive also shows...
CK-12 Foundation
Coterminal Angles: Full Circle
Take a terminal side for a spin. Pupils use an interactive to investigate angles of rotation that share the same terminal side. Scholars create coterminal angles and calculate what other angle sizes share the same final position.
CK-12 Foundation
Graphs Using Slope-Intercept Form: Mountain
Climb every mountain, even one you create in an interactive. Individuals solve a problem involving slopes and distances of campsites on a mountain. Answering a set of challenge questions aids in the process.
CK-12 Foundation
Fundamental Counting Principle with and without Repetition: Outfit Combinations
But I have nothing to wear! Using an interactive, individuals create all possible outfits from three shirts, one belt, and two pairs of pants. Answering a set of challenge questions helps them see what they have learned from the experience.
CK-12 Foundation
Permutations: Podiums
Add a winning resource to your library. A self-paced interactive has users create a sample space for all possibilities of arranging first- and second-place winners on a podium. The results lead to the realization that permutations and...
CK-12 Foundation
Basic Geometric Definitions: Alternate Dimensions
How do you calculate problems in alternate dimensions? The interactive allows learners to manipulate points in 2-D as scholars explore the relationship the points must have to create a one-dimensional object. Pupils identify objects that...
CK-12 Foundation
Congruent Angles and Angle Bisectors: Bisecting Pepperoni Pizza
Who doesn't like pizza? A creative lesson uses a piece of pizza to explore angle bisectors and congruent angles. Young scholars work through a simulation to create congruent slices of pizza by analyzing an angle bisector. They then...
CK-12 Foundation
Domain and Range of a Function: Making Money Math
Graphs are useful for many things, including seeing how much money you can make. Individuals create a graph of earnings from a job based on the number of hours. They determine the domain and range of the graph and answer challenge...
CK-12 Foundation
Two-Step Equations with Subtraction and Multiplication: Cupcake Equation
Solving equations is a piece of cake. Young mathematicians use an interactive to create a bar model to representing a situation involving cupcakes. They use the model to solve for the cost of a cupcake.
CK-12 Foundation
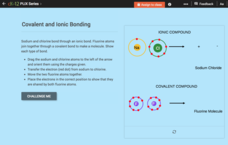
Chemical Bonds: Covalent and Ionic Bonding
Get back to bonding basics. Science scholars get a chance to show what they know using a simple interactive. Pupils create models of covalent and ionic bonds before answering questions about each interaction. The resource includes a...
CK-12 Foundation
Expressions for Real-Life Situations: Shopping for Sisters
Shopping for a resource on writing algebraic expressions? Look no further. Pupils use an interactive to drag shirts and pants out of a shopping bag. They create and evaluate an expression to represent the cost of the clothes.
CK-12 Foundation
The Real Numbers: Number System
Get real about learning the real number classification. Young mathematicians create a graphic organizer of the real number system using an interactive. They answer a set of challenge questions on the classifications of real numbers.
CK-12 Foundation
Data Summary and Presentation: Chart for Grouping Data
Get social! Create a display of social media use for a class. Pupils use provided information about the time spent on social media to construct a histogram. Using the histogram, learners interpret the data to answer questions.
CK-12 Foundation
Single Bar Graphs: Cupcakes
What is a little cake among friends? Given the relationship between the number of cupcakes five friends have, pupils create a bar graph. The learners answer questions about the graph and adjust the graph if one friend shares some of his...
CK-12 Foundation
Interpretation of Circle Graphs: Northwest Region Population Pie
Given populations of the five Northwestern states, learners create a circle graph. Using the data and the pie chart, they make comparisons between the populations of the states. Finally, the pupils determine how the chart will change...
CK-12 Foundation
Pie Charts: Soda Party
Using the interactive, pupils create a pie chart that represents the percentage of sodas bought for a party. Individuals need to determine the percentage and number for the final variety of drinks. The learners determine how the...
CK-12 Foundation
Types of Data Representation: Baby Due Date Histogram
Histograms are likely to give birth to a variety of conclusions. Given the likelihood a woman is to give birth after a certain number of weeks, pupils create a histogram. The scholars use the histogram to analyze the data and answer...


