Curated OER
Bar Graphs and Pictographs
How are bar graphs and pictographs different? As you begin this concept, use these simple graphs to help get learners started with data analysis styles. There is one bar graph and one pictograph, each accompanied by four or five...
Curated OER
Figure This! Math Challenges for Families
Young mathematicians complete a family math challenge packet. They will complete a packet of mixed math activities. They work with graphs, comparing numerical data, tessellations, and probability.
Curated OER
World Oil Reserves: Assignment
Understanding and analyzing data is a critical skill. Included here are three worksheets a list of countries with the largest oil reserves, a graph of the same, and an assignment. The class uses their data to create a bar chart then...
Curated OER
Where We Live
Who has the most? Young learners practice charting data using familiar information. They help fill out a classroom chart by recording the number of people, pets, televisions, etc. in their home. Guiding questions help them investigate...
Curated OER
Bar Graphs
Introduce scholars to bar graphs and data analysis through analyzing these visual examples. First, they look at a pictograph of fruit types and answer five observation questions. There is one done for them as an example. Learners do the...
Curated OER
Bar Graphs
What are these bar graphs depicting? Novice data analyzers examine two basic bar graphs and answer three comprehension questions about each. The first graph shows tickets sold per date and the next is distances run per member of a cross...
Curated OER
Reading Charts
How well can your third graders interpret data from a chart? Use this straightforward learning exercise to reinforce problem-solving skills. After reading a school schedule, pupils answer ten questions about the information in the chart....
Curated OER
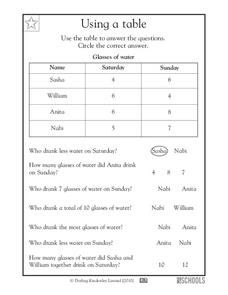
Using a Table
Tables are no help if your scholars can't read them; provide some excellent beginner-practice using this table example and accompanying comprehension questions. Learners examine the data first, which charts the number of glasses of water...
Curated OER
Reading Tally Chart
As learners explore data analysis have them practice reading tally charts using these examples. They answer basic questions about each of three charts, employing addition and subtraction skills. For example, a chart tallying t-shirts...
DK Publishing
Using Information in Tables
Find out how well can your second or third graders use tables to solve word problems by assigning this single-page worksheet. Two tables with different sets of data prompt learners to solve six problems. An example at the top of the page...
Curated OER
Reading Tables
Who is two years younger than Meg? Who is older than Paul, but not Kinta? Scholars practice reading tables as they answer comprehension questions based on three sets of data. First, they examine a table depicting ages, then favorite...
US Department of Energy
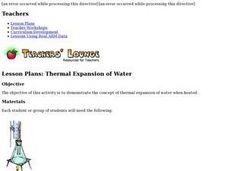
Thermal Expansion of Water: Rise of Sea Level
Using bunsen burners, Erlenmeyer flasks, thermometers, hollow glass tubes, stoppers, and rulers, learners experiment with and measure how water expands when heated. The activity connects the expansion of water when heated to global...
Curated OER
Fossil Find
Students investigate the practice of digging for fossils. They participate in a mock dig of fossils using real bones and other artifacts. Then students dig through sand in order to go through the simulation. Students make observations...
Curated OER
NUMB3RS - Season 2 - "Convergence" - Air Hockey
Learn how to use a matrix to organize data to solve a problem. This activity uses wins and losses to rank players for an air hockey tournament they wish to have. After practicing some basic matrix operations the class could do the...
Curated OER
Probability and the U.S. Map
Learners solve and complete 20 different problems that include using a U.S. map and data table. First, they calculate the probability that they will select a state that begins with each letter of the alphabet. Then, everyone completes...
Curated OER
Bar Graphs and Line Graphs
In this bar graphs and line graphs worksheet, students examine given data, organize it, and create bar graphs and line graphs from the given information. They interpret graphs and write statements explaining the graph. This one page...
Curated OER
Measures of Central Tendency
Here is a measures of central tendency worksheet in which learners solve five multiple choice problems. They find the mean, median, and mode of a data set.
Curated OER
Count the Images!
Based on a selection of images, learners create a bar graph depicting how many of each image is shown. There are two graphs, each with three images to chart. After they are finished, scholars can analyze the data and draw conclusions. To...
Curated OER
Position Within a Set
Your students will have no problem relating to this word problem involving a toy car race: there are three cars, and they come in first, second, and third place in a race down the driveway. Learners analyze the data by writing the...
Curated OER
Line Graphs
Let's take a look at Luis' bike ride! Scholars examine a line graph charting a 20-kilometer bike ride over the course of six hours. They answer six questions about the data requiring the understand the concepts of each axis and the line...
Curated OER
Using Bar Graphs
What's your favorite pizza topping? Scholars analyze two bar graphs, one depicting a math club's favorite pizza toppings and the other ice cream sales per flavor. As they examine the graphs, learners answer a few comprehension questions....
Curated OER
Tallies
Tally Marks are a wonderful way to keep track of data, and to foster counting for your young mathematicians. This resource has learners identify the correct number of tally marks for a given number. The numbers used are: 13, 15, 17, and...
Curated OER
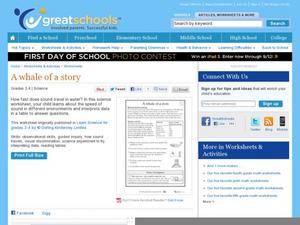
A Whale of a Story
Does sound travel faster in water or in the air? Put the question to the test with a science experiment. After reviewing a table of data, third and fourth graders decide which statements are true and which ones are false. The bottom of...
Curated OER
Are These Made of Metal?
How can you tell if something is made of metal? Use a table of data and a science experiment to determine which items are made of metal. The experiment requires adult supervision, as it instructs third graders to build an electrical...
Other popular searches
- Data, Census, & Statistics
- Data Analysis Pictograph
- Data Table
- Categorical Data
- Data Analysis Lesson Plans
- Data Management
- Data Analysis Graphing
- Data Analysis and Graphs
- Science Fair Project Data
- Data Display
- Organizing Data
- Census Data


