Curated OER
What's Up With My Class
Learners collect data about their class and they use Excel spreadsheet to display their tables and graphs about the class. They answer survey questions and collect their data. Students create a graph of their choice to display the...
Curated OER
Play It
There are a number of activities here that look at representing data in different ways. One activity, has young data analysts conduct a class survey regarding a new radio station, summarize a data set, and use central tendencies to...
Curated OER
Seeing Is Believing
Students investigate the concepts of probability. They use data to find the central tendency, median, and mode. Students design and play a game in order to practice the concepts. They also complete a table with data that is analyzed.
Florida Department of Health
Nutrition: Developing Healthy Habits Unit
The focus of the fourth unit in the Youth Risk Behavior Survey Curriculum is on healthy eating and exercise. Class members examine healthy habits data from the YRBD Youth Online Tool, learn about the importance of a healthy diet and...
Florida Department of Health
Safe and Happy: Safety for All at School and Online Unit
Bystander or upstander and advocate? Three lessons have high schoolers investigating data about bullying and school safety. Participants then learn how to take a stand against bullying and use what they have learned to create a PSA to...
Curated OER
Data Analysis: Graphs, Charts, Tables, Statistics
In this data analysis worksheet, students interpret data in 5 problems involving graphs, tables, and scatterplots. Students construct 1 stem and leaf plot and find the mean, median, and mode of a data set.
Curated OER
The Gathering and Analysis of Data
Young mathematicians gather data on a topic, graph it in various forms, interpret the information, and write a summary of the data. They present their data and graphs to the class.
Curated OER
How do We Treat Our Environment?
Seventh graders explore the concept of collecting data. In this data collection instructional activity, 7th graders survey others about their environmental habits. Students graph their data.
Curated OER
Opinion Surveys
Students examine the factors that affect the accuracy of opinion surveys. They calculate probability and chance using data they have collected. They practice reading tables and graphs as well.
Power to Learn.com
Survey of Favorites
Upper grade and middle schoolers discuss their favorite TV programs, music, books, etc. Following a lesson on measures of central tendency, learners discuss random sampling. They conduct a survey and use charts and frequency tables to...
Curated OER
Tall Tale Rollers
Students explore American tall tales. In this tall tale lesson, students discover the six characteristics that are included in tall tales. Students survey their class to find each student's favorite tall tale character and organize the...
Curated OER
Data Analysis Digital Display
Students create a survey online. In this math lesson, students graph survey data using flisti.com. They share and analyze their classmates' histogram.
Curated OER
Hand Span and Height
Is there a relationship between hand span width and height? Statisticians survey each other by taking measurements of both. A table that can hold data for 24 individuals is printed onto the worksheet, along with questions for analysis....
Curated OER
The Survey Says
Young scholars experience the development of statistical data. In groups, they construct a survey questionnaire for a target audience. Students produce the questionnaire, distribute it, collect it, and tabulate the data. Using EXCEL,...
Curated OER
And the Survey Says...
Learners use technology to input, retrieve, organize, manipulate, evaluate, and communicate information; apply appropriate technologies to critical thinking, creative expression, and decision-making skills. They collect and explore data...
Curated OER
Closing the Case
Fifth graders collect data and prepare data displays using a survey with statistical information.
Curated OER
Reading the Neighborhood
First graders complete activities with the story One Monday Morning in the Macmillan/McGraw Hill Textbook. In this data lesson, 1st graders read the story and gather data to create a picture graph. They read the graph and answer...
Curated OER
Wiggle Worms
First graders investigate worms, collect and analyze data. In this worm and data lesson, 1st graders listen to Chick and Duckling from the Macmillan/McGraw-Hill reading series. They conduct experiments with worms, collect simple data,...
Bowland
Day Out
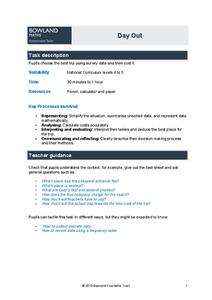
Use mathematics to help plan a field trip. Scholars use the results of a survey to determine where a class should go on a field trip. They use provided data about entrance fees and mileage to calculate the cost per person of such a trip.
Radford University
A Change in the Weather
Explore the power of mathematics through this two-week statistics unit. Pupils learn about several climate-related issues and complete surveys that communicate their perceptions. They graph both univariate and bivariate data and use...
Curated OER
Using Random Sampling to Draw Inferences
Emerging statisticians develop the ability to make inferences from sample data while also working on proportional relationships in general. Here, young learners examine samples for bias, and then use random samples to make inferences...
US Department of Commerce
Diversity: Languages Spoken in the United States
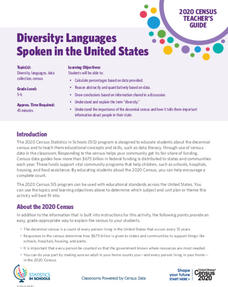
High schoolers begin a discussion on diversity and determine the percent of the population that speak another language at home in the US. Classmates make a prediction of the percentage of people that speak another language at home in...
Curated OER
Survey and Tally
Second graders view a model of a survey and tally. In this survey and tally lesson plan, 2nd graders decide on questions for a survey. Students conduct the survey and tally their results. Students create a tally chart. Students view a...
Curated OER
Atoms and Chemical Bonding
An online resource, this worksheet has your chemistry learners complete four data tables with information about atoms and chemical bonds. The first table addresses atomic number and mass, as well as numbers of protons, neutrons, and...


