Curated OER
Adopt a City-Winter Weather
In weather worksheet, students use an on line site to collect weather data. They create 10 different weather scenarios using a temperature and humidity slider. They includethe temperature, relative humidity and weather conditions and...
Curated OER
Biospheres in Your Backyard
Students collect data from a local river biome. They use the information for metric conversion and graphing equations. They study the components of what makes up a biosphere and how math is used to analyze one.
Curated OER
Numeracy Practice- Going Out For Lunch
In this math learning exercise, learners complete the various types of activities that include graphs, data tables, and completing number sentences.
Curated OER
Where do Plants Get their Food?
In this where do plants get their food worksheet, students design an experiment that will disprove the idea that plants obtain their food from soil. Students will set up their experiment and design a data table that will record data over...
Curated OER
Speed and Experiments
In this speed formula and scientific method worksheet, students read over descriptions of the formula an method. Students then respond to 12 matching, problem solving and short answer questions.
Curated OER
Making A Horizontal Bar Graph
In this bar graph instructional activity, students create a bar graph to display 6 scores from basketball games. Students will label the x and y axis and correctly plot the scores from the table provided.
Curated OER
Data Analysis
In these analyzing data worksheets, learners complete a table and a pie chart and calculate mean, median, mode, and range for sets of data.
Curated OER
Experiment Data Recording Sheet
In this science learning exercise, learners record data collected during a ten day experiment. They record the date and data collected for each of the ten days in a table on the sheet. They record the date since the data does not have to...
Inside Mathematics
Snakes
Get a line on the snakes. The assessment task requires the class to determine the species of unknown snakes based upon collected data. Individuals analyze two scatter plots and determine the most likely species for five additional data...
American Statistical Association
A Sweet Task
Candy is always an effective motivator! A fun math activity uses M&M's and Skittles to explore two-way frequency tables and conditional probability. The candy can serve a dual purpose as manipulatives and experimental data.
Statistics Education Web
I Always Feel Like Somebody's Watching Me
Future statisticians and potential psychics first conduct an experiment to collect data on whether a person can tell if someone is staring at them. Statistical methods, such as hypothesis testing, chi-square tests, binomial tests, and...
Mathematics Vision Project
Module 8: Probability
It's probably a good idea to use the unit. Young mathematicians learn about conditional probability using Venn diagrams, tree diagrams, and two-way tables. They also take into consideration independence and the addition rules.
Bowland
Day Out
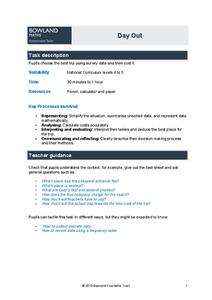
Use mathematics to help plan a field trip. Scholars use the results of a survey to determine where a class should go on a field trip. They use provided data about entrance fees and mileage to calculate the cost per person of such a trip.
Inside Mathematics
House Prices
Mortgages, payments, and wages correlate with each other. The short assessment presents scatter plots for young mathematicians to interpret. Class members interpret the scatter plots of price versus payment and wage versus payment for...
Chicago Botanic Garden
Historical Climate Cycles
Scientists use ice core samples to obtain temperatures of the earth from 400,000 years ago! The third of five lessons instructs pupils to interpret historical climate data to see changes over time. In part I, participants interpret...
Teach Engineering
Energy Perspectives
The data says ... the resource is great to use. Using Microsoft Excel, pupils analyze data from the US Department of Energy in the fifth lesson of a 25-part Energy Systems and Solutions unit. Each group looks at a different data set and...
Annenberg Foundation
Skeeters Are Overrunning the World
Skeeters are used to model linear and exponential population growth in a wonderfully organized lesson plan including teachers' and students' notes, an assignment, graphs, tables, and equations. Filled with constant deep-reaching...
Los Angeles County Office of Education
Assessment for the California Mathematics Standards Grade 5
Test young mathematicians' knowledge with an assessment aligned to California's fifth grade state standards. The exam covers a multitude of concepts including fractions and decimals, positive and negative numbers, measurement; and how to...
Bowland
Mystery Tours – Plan Your Tour
Everyone loves a vacation and a set of three activities has groups planning a tour of the U.K. using given distance, time, and price data. They solve a variety of problems related to the trip and produce a report on the success of the trip.
EngageNY
Association Between Categorical Variables
Investigate associations between variables with two-way tables. Scholars continue their study of two-way tables and categorical variables in the 15th installment of a 21-part module. The lesson challenges them to calculate relative...
Curated OER
Flicking Football Fun
Young mathematicians fold and flick their way to a deeper understanding of statistics with a fun, hands-on math unit. Over the course of four lessons, students use paper footballs to generate data as they learn how to create line...
NASA
Connecting Models and Critical Questions
Scholars use data to analyze and determine which sets of information need to be counted. They create a model to explain differences among chemical elements using graphs to prove concept mastery.
Illustrative Mathematics
Function Rules
Function machines are a great way to introduce the topic of functions to your class. Here, you will explore the input and output to functions both using numerical and non-numerical data. Learners are encouraged to play with different...
Noyce Foundation
Granny’s Balloon Trip
Take flight with a fun activity focused on graphing data on a coordinate plane. As learners study the data for Granny's hot-air balloon trip, including the time of day and the distance of the balloon from the ground, they practice...


