American Statistical Association
Spinners at the School Carnival (Unequal Sections)
Everyone's a winner. Scholars analyze a spinner with five unequal sections, three of which represent winning a toy car and the other two represent winning a toy truck. They conduct an experiment to estimate the number of toy cars and...
American Statistical Association
Scatter It! (Predict Billy’s Height)
How do doctors predict a child's future height? Scholars use one case study to determine the height of a child two years into the future. They graph the given data, determine the line of best fit, and use that to estimate the height in...
Champions for Change
How Many Cups Do I Need?
Does an apple a day really keep the doctor away? Find out by browsing through a variety of handouts and learning the recommended daily amounts of fruits and vegetables for good health. Learners will read and discuss how to visually...
Illustrative Mathematics
Runners' World
Learners must investigate the validity of a claim made in a running magazine. They must identify and look up unprovided information, make appropriate estimations, and be able to convert units. Might be best used as a group or whole-class...
Illustrative Mathematics
Reasoning about Multiplication and Division and Place Value, Part 2
The learner puts reasoning and estimation to work. The directions are to place a decimal in the answer to make the equation true. Pupils are to look at the two problems, one multiplication and one division, and estimate an answer. No...
Baylor College
Water in Your Body
Do you know how much water you have had in the last 24 hours? Do you know how much your body needs? In this hands-on activity, your class members will estimate how much water our bodies lose each day by filling and emptying one-liter...
BioEd Online
Serving Sizes
When it comes to eating a balanced diet, portion control is paramount, but what is the difference between the serving size on the nutrition facts label and a portion as determined by the USDA? In a comprehensive look at portion control,...
Baylor College
What is Air? Pre-Assessment
First, estimate existing knowledge about air with a class discussion. Then, hand out a 10-question pre-assessment quiz to record how much pupils know to compare to their knowledge later. This will also give mini meteorologists the...
Federal Reserve Bank
The Output Gap: A‘Potentially’ Unreliable Measure of Economic Health?
How can we accurately estimate what the economy should produce now and in the future? Have your pupils tackle this question as they learn about real versus potential GDP and as they review data regarding the output gap in the United States.
Illustrative Mathematics
Solar Eclipse
Learners take on the role of astronomers, calculating conditions necessary for a total solar eclipse. Concepts of similar triangles and properties of circles come together as pupils create ratios and use real measurements in determining...
E Reading Worksheets
Context Clues Vocabulary Builder Activity
Reading comprehension improves when you can use context clues to define unfamiliar words. Help your kids practice using context clues with a worksheet that provides space for seven sentences with new words, as well as a place for kids to...
EngageNY
Summarizing Deviations from the Mean
Through a series of problems, learners determine the variability of a data set by looking at the deviations from the mean. Estimating means of larger data sets presented in histograms and providing a way to calculate an estimate round...
Liberty Union-Thurston
Equivalent Fractions
The next lesson in a math series builds off the previous one in which learners estimated fraction amounts using fraction bars. Here, pupils view equivalent fractions with unlike denominators using fraction bars. Lastly, they complete a...
Houghton Mifflin Harcourt
Unit 2 Math Vocabulary Cards (Grade 3)
A set of third grade math vocabulary cards include topics that range from addition properties to terms like estimate and fact family. Each sheet has two cards on it. The top half is the word printed in bold text, while the bottom is the...
Charleston School District
Evaluation of Roots
You mean the square root of five and five don't have the same value? Learners estimate the value of irrational roots. As they practice estimating the value, they increase their understanding of roots. The lesson is the fourth in a series...
Curated OER
Dental Impressions
What an impressive task it is to make dental impressions! Pupils learn how dentists use proportional reasoning, unit conversions, and systems of equations to estimate the materials needed to make stone models of dental impressions....
Mathematics Assessment Project
Sampling and Estimating: Counting Trees
Your task today: count all the trees on a tree farm. To complete the assignment, learners first estimate the number of trees on a tree farm using random sampling. To improve their own response they then evaluate provided responses to the...
Curated OER
Sunrise, Sunset
What locations on Earth get the longest number of hours of daylight in the summer? Hint: It's not the equator! Use real-world sunrise and sunset data to develop trigonometric models that can be used to estimate the number of hours of...
Mathematics Assessment Project
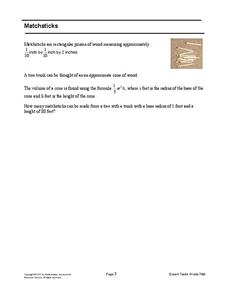
Matchsticks
How many matchsticks can be made from a single tree? That is the problem facing middle schoolers. Scholars first determine the volume of a matchstick given its dimensions, and then use this information to estimate the number of...
EngageNY
Distributions—Center, Shape, and Spread
Data starts to tell a story when it takes shape. Learners describe skewed and symmetric data. They then use the graphs to estimate mean and standard deviation.
EngageNY
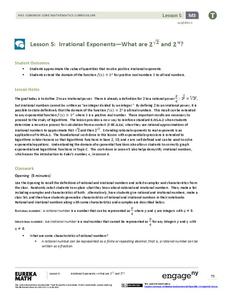
Irrational Exponents—What are 2^√2 and 2^π?
Extend the concept of exponents to irrational numbers. In the fifth installment of a 35-part module, individuals use calculators and rational exponents to estimate the values of 2^(sqrt(2)) and 2^(pi). The final goal is to show that the...
Rainforest Alliance
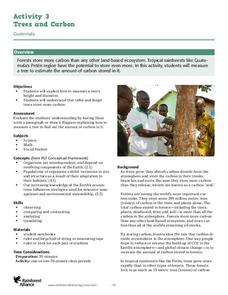
Trees and Carbon
You'll find everything but the kitchen sink here ... or just a carbon sink. In the activity, pairs or groups of middle school learners go outside and measure a tree's circumference and height to estimate its carbon storage potential and...
EngageNY
Building Logarithmic Tables
Thank goodness we have calculators to compute logarithms. Pupils use calculators to create logarithmic tables to estimate values and use these tables to discover patterns (properties). The second half of the lesson has scholars use given...
Bowland
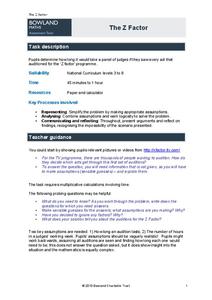
The Z Factor
Young mathematicians determine the number of hours it would take judges of the "Z Factor" television talent show to watch every act. Participants make estimates and assumptions to solve the problem.
Other popular searches
- Estimate Fractions
- Compatible Numbers to Estimate
- Estimate Angle Measurement
- Estimate and Measure Length
- Estimate Quotient
- Estimate the Sum
- Estimate Percent
- Estimate Measure Weight
- Estimate by Rounding
- Magnitude Estimates
- Estimate Numbers
- Estimate Fractions For


