Richland Community College
Richland Community College: Stats Graphs Defined
Richland Community College provides a glossary of many terms that are needed in order to understand statistics graphs and charts. Each of the types of charts is quickly explained in terms of what it is most effective in displaying.
Physics Aviary
Physics Aviary: Any Given Sunday Lab
This lab is designed to be used by an entire class to simulate 50 football seasons. Students will track the number of wins and then we will make a distribution graph to see the frequency of the different outcomes.
Sophia Learning
Sophia: Introduction to Probability
Introduction to Probability is a resource that provides assessment and teacher tutorials that focus on mathematic concepts such as probability, outcomes, events, probability distribution, laws, values and odd.
TOPS Learning Systems
Top Science: Tack Toss [Pdf]
An activity where students toss a set of tacks one hundred times and plot how many land on their sides each time. They then calculate the mode, median, and mean.
Khan Academy
Khan Academy: Valid Claims
Practice figuring out whether we took a random sample and whether we're able to draw valid conclusions from our data. Students receive immediate feedback and have the opportunity to try questions repeatedly, watch a video or receive hints.
Khan Academy
Khan Academy: Two Way Tables Review
Two-way tables organize data based on two categorical variables.
Other
Grinnell College: Histograms Area of Rectangles
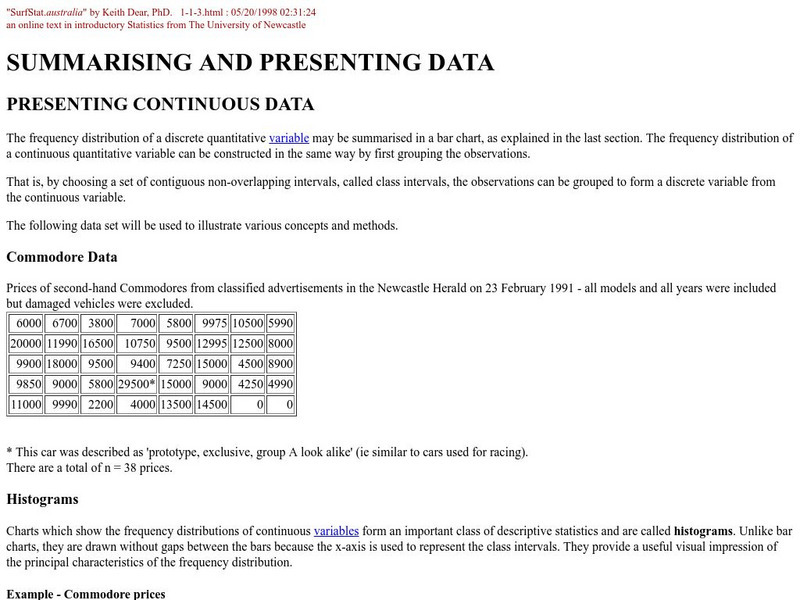
A sample problem is provided to help you create a histogram using a frequency distribution chart. Sample charts and formulas are provided to help explain how to find the area of the rectangles in the histogram and how to interpret what...
Other
Stat Soft: Statistics Glossary
Dozens of statistical terms are defined and illustrated in this glossary.
University of Illinois
University of Illinois: Rollin' Rollin' Rollin'
This page from the University of Illinois is the beginning of a series that demonstrates the difference between the mean and median of a group of numbers. The sites use bar graphs to display the data.
University of Illinois
University of Illinois: Spreading It Thick
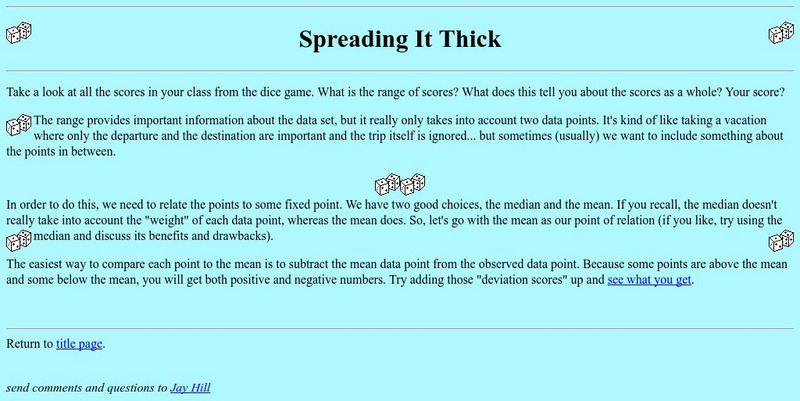
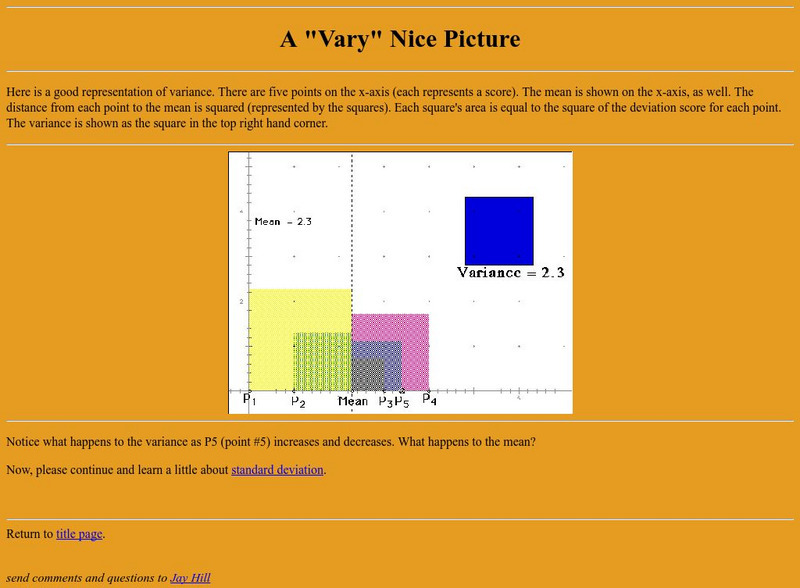
Resource contains the definition for variance. It also shows students how to calculate the variance. There is a link to a bar graph that displays variance for the data example.
Varsity Tutors
Varsity Tutors: Hotmath: Practice Problems: Tables and Graphs
Six problems present various aspects of using and making tables and graphs to display statistics. They are given with each step to the solution cleverly revealed one at a time. You can work each step of the problem then click the "View...
Illustrative Mathematics
Illustrative Mathematics: S Cp How Do You Get to School?
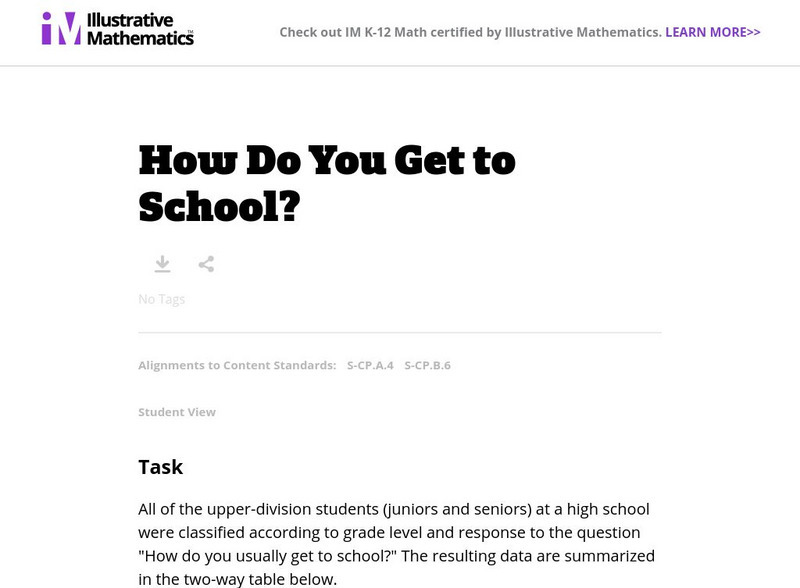
All of the upper-division students (juniors and seniors) at a high school were classified according to grade level and response to the question "How do you usually get to school?" The resulting data are summarized in a two-way table and...
University of Illinois
University of Illinois: Mste: Is There a Standard for All This Deviation?
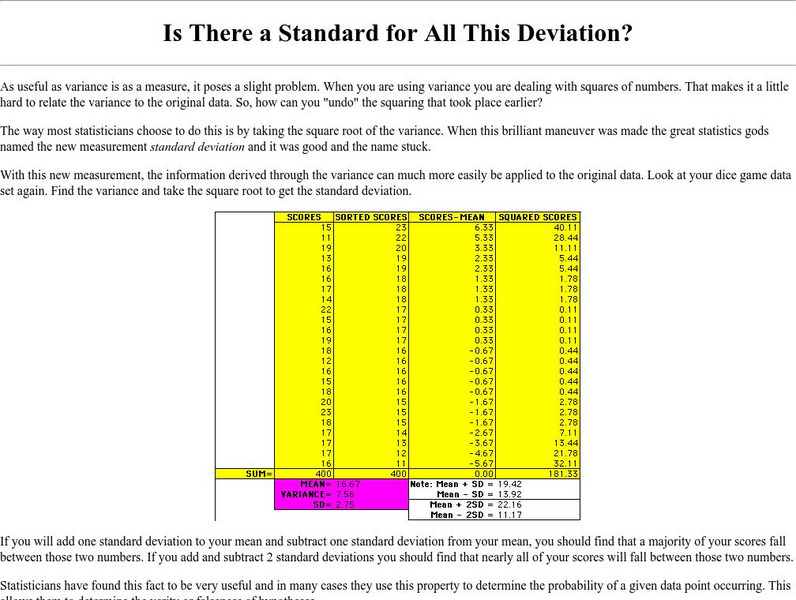
Site contains information on the statistical term standard deviation. It gives a definition and shows how to calculate it. It has a link to information on the absolute value of a deviation and how the topics are related.
University of Illinois
University of Illinois: A "Vary" Nice Picture
Site from the University of Illinois contains a graphical representation of variance. A follow-up question for the user and a link to standard deviation - a related statistical topic - are also provided.
Calculator Soup
Calculator Soup: Percentile Calculator
Enter a data set and the percentile calculator finds the percentile you need.
Khan Academy
Khan Academy: Creating Dot Plots
Practice creating dot plots. Dot plots are very similar to frequency tables, but they make it easier to see the data. Students receive immediate feedback and have the opportunity to try questions repeatedly, watch a video or receive hints.
Other
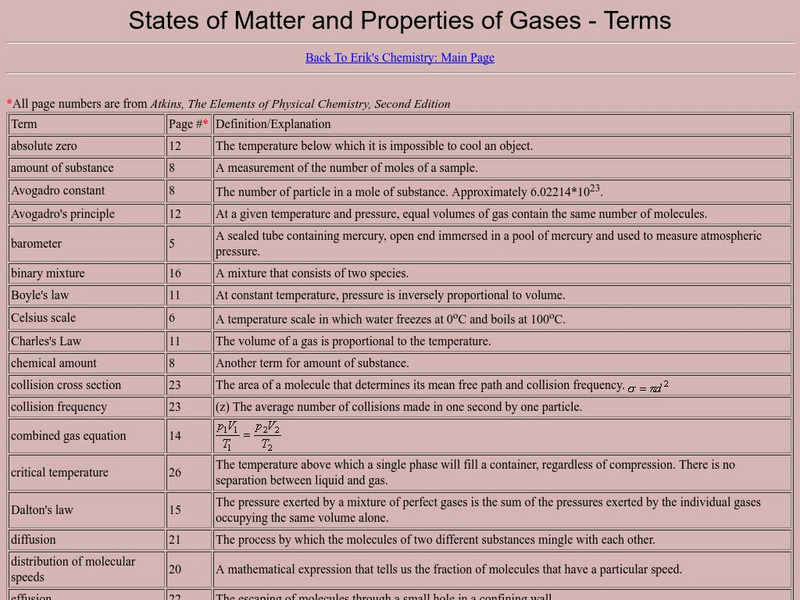
States of Matter and Properties of Gases: Terms
A very complete list of terms that are important to the study of gases. This resource is a web archive.


