Curated OER
Use Google Maps to Teach Math
Capture the engagement of young mathematicians with this upper-elementary math instructional activity on measuring time and distance. Using Google Maps, students first measure and compare the distance and time it takes to travel...
PBS
Map a Model Solar System
Creating a solar system map is a snap thanks to a hands-on activity! Science scholars explore the solar system by building it wherever they choose during an interactive from PBS's Space series. Users pick both the location and scale for...
Discovery Education
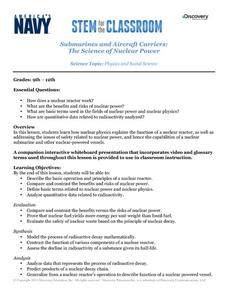
Submarines and Aircraft Carriers: The Science of Nuclear Power
As physics masters view this presentation, they learn how nuclear power is used in submarines. They use Google Maps to plot a course through the ocean and calculate the time required for surfacing and traveling. They learn about fission,...
Curated OER
Designing and Creating Earth Science Lessons with Google Earth
Everything from adding an overlay to uploading images to navigating the software, teachers become apt at using Google Earth™ in the classroom to create Earth Science lessons.
Education World
Edible Resource Maps!
Young scholars discuss resource maps and examine examples from library resources. Working in groups, they create edible resource maps by drawing examples, such as popcorn on the border of Iowa and Nebraska. Then they use cookies in the...
Curated OER
The Water Nearby
Students explore water located near where they live. In this map skills maritime lesson, students use Google Maps to find their school and the body of water closest to them. Students research the body of water and answer questions about it.
Geophysical Institute
Latitude and Longitude with Google Earth
Travel the world from the comfort of your classroom with a lesson that features Google Earth. High schoolers follow a series of steps to locate places all over the earth with sets of coordinates. Additionally, they measure the distance...
Teach Engineering
Where Are the Plastics Near Me? (Mapping the Data)
The last activity in a nine-part series has teams create a Google Earth map using the data they collected during a field trip. Using the map, groups analyze the results and make adjustments to the map to reflect their analysis. A short...
Howard Hughes Medical Institute
Sorting Finch Species
Don't just tell your class about Darwin's finches ... show them! Sort some of science's most famous birds using an interactive lesson. Learners try their hand at classifying finches using song, sonogram, and beak appearance, as well as...
University of Southern California
What Is The Ocean?
Go on a tour of the ocean through the lens of a scientist. Learners read maps of the ocean floor, study tide behavior, examine wave motion, and analyze components of soil. Each lesson incorporates a hands-on component.
Curated OER
Changing Planet: Permafrost Gas Leak
Pair earth scientists up to use an amazing online arctic portal mapping tool and Google Earth to analyze permafrost changes. They compare changes to data on atmospheric concentrations of methane to see if there is a correlation. Then...
Teach Engineering
Searching for Bigfoot and Others Like Him
Individuals create a GIS data layer in Google Earth that displays information about where one might find seven different cryptids. The class members research to find data on cryptid sightings they can include in their data...
National Nanotechnology Infrastructure Network
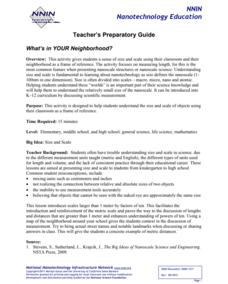
What’s In Your Neighborhood?
Chart your way to an understanding of nanoscale. Using a Google map, learners estimate a radius around their location of 1,000 and 1,000,000 meters. Predicting what 1,000,000,000 meters would look like takes them off the charts!...
Newark Public Schools
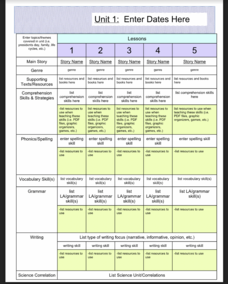
ELA Curriculum Map
Organize your curriculum of narratives and stories within an ELA unit and keep track of what elements are needed to ensure the unit's success. This curriculum map template allows you to plan for supporting texts, comprehension...
California Mathematics Project
Meteorology
See how estimation is essential to making temperature weather maps. Scholars use ratios and rates of change to estimate temperatures at locations where temperature readings have not been made. They connect this idea to linear functions.
Teach Engineering
Projections and Coordinates: Turning a 3D Earth into Flatlands
Introduce your class to map projections and coordinates, the basics for the work done in a GIS, with an activity that uses Google Earth to challenge learners to think about the earth's shape.
National Wildlife Federation
Go with the Flow
The quality of a watershed has a direct impact on the community it services. Learners study their own watershed using a topographical map. They recreate the watershed components using colored pencils to track the upstream and downstream...
California Academy of Science
A Day in the Life of a San Francisco Native Animal
Before Google, before Sillicon Valley, before the Gold Rush, the San Francisco landscape was a biome filled with grizzly bears, mule deer, tule elk, coyotes, gray fox, gophers, and moles. To explore the early days of yesteryear, kids...
Curated OER
Google Earth
For this Google Earth worksheet, learners access the Google Earth website and find the latitude, longitude, and elevation for their house and school. Then they do the same for a variety of world locations. This worksheet has 10 fill in...
Center Science Education
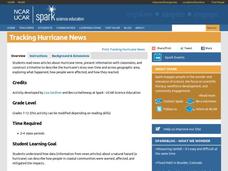
Tracking Hurricane News
Here is a unique twist for your lesson on hurricanes. After examining extreme weather news headlines, your storm chasers view a PowerPoint about hurricanes and then zoom in on Hurricane Irene. They map a timeline of her trek up the East...
Curated OER
You Can Die Here – Death Valley California
Students use Google Maps to explore the rain shadow desert. In this climate instructional activity, students use the Internet, Google Maps, and directed inquiry worksheets to understand how rain shadow deserts form. Students apply...
Teach Engineering
Let's Get it There Fast
Are planes the best shipping method? Using maps, pupils determine the fastest mode of transportation between two cities. Given a list of items to ship, groups decide the best shipping method to finish the 18th segment of a 22-part unit.
Curated OER
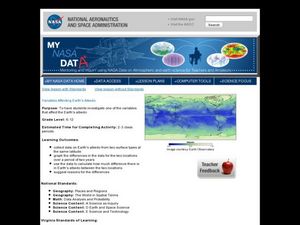
Variables Affecting Earth's Albedo
Learners study the variables that affect the Earth's albedo. In this environmental data analysis lesson students interpret and graph information and calculate changes.
Curated OER
Mapping the National Parks
Students research national parks. In this science lesson, students view a video about the national parks and discuss the environments found within the national parks.


