Curated OER
Graph a Picture on Cartesian Coordinates
Find out what picture is hidden in this graph and work on coordinate graphing with this worksheet! Learners plot 66 ordered pair points on a Cartesian graph, then connect the dots to make a picture. This would work as an in-class...
Curated OER
Graphs: Students in Math Classes
Are your second and third graders just beginning to read bar graphs? This graph looks at the number of learners present in a math class Monday-Friday. Learners look for basic information, and the graph is easy to read.
CK-12 Foundation
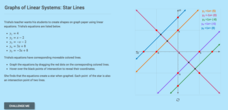
Graphs of Linear Systems: Star Lines
Let the class stars shine. Using four given linear equations, scholars create a graph of a star. The pupils use the interactive to graph the linear systems and determine the points of intersection. Through the activity, classmates...
Curated OER
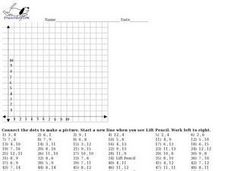
Graph Picture (Coordinate Pairs) 2
Looking for an engaging way to encourage your class to practice graphing coordinate pairs? This might be the activity you are looking for! For this activity, learners create a picture by plotting 54 coordinate pairs on graph and then...
Curated OER
Graph Picture (Coordinate Pairs) 3
Here is a very good coordinate graphing worksheet. Learners practice graphing by plotting 58 coordinate pairs, then connecting the dots to reveal a picture. This resource could be used as an in-class activity or a homework assignment.
K-5 Math Teaching Resources
Graph Paper
You'll never have to buy graph paper again with this printable resource, which can be used for anything from creating graphs, plotting points in the coordinate plane, or measuring the area and perimeter of polygons. A helpful resource...
CK-12 Foundation
Double Bar Graphs: Favorite Cookies Chart
It's just the way the cookie crumbles. Using the data from a class poll, learners create a double bar graph showing favorite cookie types. The pupils compare favorites between boys and girls with the aid of their graphs, then they make...
CK-12 Foundation
Broken-Line Graphs: Heating Curve of Water
Examine the unique graphs coined broken-line graphs. Using the phase change of water for data, learners answer questions related to the temperature and energy at different times in the cycle of the phase change. Questions focus on the...
EngageNY
Graphing Rational Functions
Put everything together in a picture. Scholars take what they learned in the previous three lessons in the 15th segment of a 23-part unit to graph rational functions. They find the end behavior, the horizontal and vertical asymptotes if...
CK-12 Foundation
Single Bar Graphs: Hockey Teams
Raise the bar for hockey fans. Using data about favorite hockey teams, pupils build a bar graph. They use the information from the graph to make comparisons and solve one- and two-step problems.
CK-12 Foundation
Multiple Line Graphs: Jack's Jumpshot
What are the advantages to seeing multiple data sets on the same graph? Scholars explore this question as they manipulate the animation within the lesson. Questions within the interactive ask individuals to make comparisons across the...
Flipped Math
Unit 10 Review: Graphing Sine and Cosine
Go up and down with a review. Learners review finding the amplitude, midline, period, and frequency of sinusoidal functions and use that information to draw graphs. Pupils arrive at equations for function from graphs. They finish up the...
CK-12 Foundation
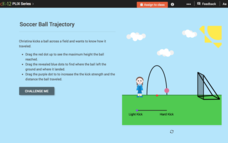
Quadratic Functions and Their Graphs: Soccer Ball Trajectory
Determine critical points in the flight of a soccer ball. Pupils use an interactive resource to find the vertex and x-intercepts of the graph of the trajectory of a soccer ball after being kicked. Scholars investigate the trajectory...
CK-12 Foundation
Graphs of Systems of Linear Inequalities in Two Variables: President Jefferson's Octagonal Home
Mathematically complete a set of blueprints. Using eight linear inequalities, pupils create a blueprint of Thomas Jefferson's home. Individuals graph the linear inequalities and position the solution of the inequalities before...
CK-12 Foundation
Graphs of Functions Based on Rules: Plotting Profits
Profit from this interactive on graphing and interpreting functions. An interactive allows learners to plot a square root function representing a company's profits. They answer some challenge questions that require interpreting this...
Curated OER
Which is Your Favorite Season?: Graph
Here is a clever seasons bar graph worksheet. Children will ask their classmates which season they prefer, and record the responses to complete the graph.
Curated OER
Create a Graph Online
Scholars create colorful bar, line, or pie graphs. They decide on a survey question to ask or a type of data to gather. From there, they collect information and data. They display this data in bar, line, or pie graphs that they create...
Inside Mathematics
Graphs (2007)
Challenge the class to utilize their knowledge of linear and quadratic functions to determine the intersection of the parent quadratic graph and linear proportional graphs. Using the pattern for the solutions, individuals develop a...
Inside Mathematics
Graphs (2004)
Show your pupils that perimeter is linear and area is quadratic in nature with a short assessment task that requests learners to connect the graph and equation to a description about perimeter or area. Scholars then provide a...
Balanced Assessment
A Run for Two
Develop a graph to represent the distance between two cars. The assessment task presents a scenario in which two cars are traveling at constant speeds with one faster than the other. Pupils develop graphical representations to show the...
Physics Classroom
Position-Time Graphs - Conceptual Analysis
Increasingly, colleges and employers want applicants with strong conceptual analysis skills, so give them some practice! Applying these skills to position-time graphs encourages synthesis of knowledge. To complete an installment of a...
PHET
Graphing Quadratics
Quadratics only have three terms, but each one is fairly important. Scholars use an interactive to explore how each coefficient affects the graph of a quadratic function. They also see how changes to the vertex form and how changes to...
Kid Zone
Groundhog's Day Graphing
This Groundhog's Day, challenge scholars to predict, estimate, tally, and graph in a weather-themed lesson in which class members play the role of the groundhog to forecast the weather come February second.
Corbett Maths
Area under a Graph
What? The calculation of area is a linear distance? A short video shows how to use the areas of simple polygons to estimate the area under a graph. Pupils divide the area under a curve into figures to easier calculate the area. Given...
Other popular searches
- Coordinate Graphing Pictures
- Charts and Graphs
- Graphic
- Graphic Organizers
- Graphing Ordered Pairs
- Bar Graphs
- Circle Graph
- Vertex Edge Graph
- Graphing Skills Lesson Plans
- Graphic Design
- Line Graphs
- Double Bar Graph


