Mathematics Vision Project
Equations and Inequalities
Help learners get their facts in line to build and solve complicated linear equations and inequalities. Pupils build upon their knowledge of solving basic equations and inequalities to solve more complex ones. Individuals work with...
Google
Foldable Inequalities
Your learners will enjoy this simple summary of finding and graphing the solutions to variable inequalities.
Illustrative Mathematics
Telling a Story With Graphs
Turn your algebra learners into meteorologists. High schoolers are given three graphs that contain information about the weather in Santa Rosa, California during the month of February, 2012. Graph one shows temperatures, graph two...
Curated OER
Graphing Standard Form Inequality
Learners solve equations and graph it. In this algebra lesson plan, students solve inequalities and rewrite them in the slope intercept form. They graph the boundary lines first either as dashed or solid and shade the correct side of the...
Curated OER
Inequalities Compound Fram
Students practice graphing compound inequalities. They draw a Venn Diagram on two different sports visualizing that their is a middle section on commonality among the two sports groups and then relate that concept to compound inequalities.
02 x 02 Worksheets
Absolute Value Equations and Inequalities
Demonstrate the meaning of an absolute inequality using three different methods. Here, scholars explore absolute value inequalities through graphing, number line distance, and compound inequalities. Pupils complete various activities to...
EngageNY
Finding Systems of Inequalities That Describe Triangular and Rectangular Regions
How do you build a polygon from an inequality? An engaging lesson challenges pupils to do just that. Building from the previous lesson in this series, learners write systems of inequalities to model rectangles, triangles, and even...
CK-12 Foundation
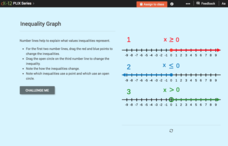
Inequality Expressions: Inequality Graph
Don't let inequalities be a drag. As young mathematicians drag the endpoint of the graph of an inequality in an interactive, the algebraic form of the inequality changes. This helps them see how the graph connects to the inequality.
Balanced Assessment
Multi-Graphs
So many things change as time goes by. Here, scholars create graphs based on this premise. Each problem asks pupils to sketch a graph that describes a given situation. Their graphs represent various characteristics such as height,...
CK-12 Foundation
Checking Solutions to Inequalities: Apples and Bananas Shopping Excursion
Go bananas over a fun interactive! Learners drag a point on a virtual graph of an inequality to see if it is a solution. This helps determine the possible numbers of apples and bananas a shopper can buy with a given amount of money.
Mathed Up!
Inequalities
Develop an understanding of things that are not equal. The video demonstrates three types of questions involving inequalities as a review for the General Certificate of Secondary Education math assessment. Pupils work through the...
Flipped Math
Unit 2 Review: Create and Solve Equations and Inequalities
Start with the basics. Pupils work through a review of the unit on equations and inequalities. Learners begin with solving equations and inequalities with no context, move on to problems that involve a context, and finish with a...
West Contra Costa Unified School District
Connecting Graphing and Solving Absolute Value Equations and Functions
Can you solve an equation graphically? Absolutely! This Algebra II lesson makes the connection between solving an absolute value equation and graphing two functions. Graphing absolute value functions is presented through the process of...
Balanced Assessment
Toilet Graph
Mathematics can model just about anything—so why not simulate the height of water in a toilet bowl? The lesson asks pupils to create a graphical model to describe the relationship of the height of the water as it empties and fills again....
Curated OER
Graphing Inequalities in Two Variables
In this graphing inequalities instructional activity, 9th graders solve and graph 6 different problems that include two variables. First, they define the given vocabulary terms found at the top of the sheet. Then, students graph each...
Curated OER
Inequalities and Their Graphs
In this inequalities and graphs learning exercise, students draw graphs for given inequalities. They identify less than, greater than, less than or equal to and greater than or equal to. Students write inequalities for given graphs. This...
Curated OER
Graphing Linear Equations and Inequalities
Students discuss methods to solve equations and inequalities with one variable. As a review, they write Addition and Subtraction properties of equality and Multiplication and Division properties of equality. Students graph points, write...
Curated OER
Tim and Pat at the Store: Bar Graphs
Do you like candy? Tim and Pat go to the candy store every day after school. Can you use the chart to determine how much money they spend each day? Does one spend more than the other?
Curated OER
Graphs
In this graphs worksheet, students solve and complete 15 various types of problems. First, they determine the range of the function of the graph shown and write in interval notation. Then, students find the domain of the function in the...
Curated OER
Graphing Inequalities
In this graphing inequalities worksheet, students solve and graph the solution set for eight inequalities. They first solve each inequality, either for x or for y, then they plot the coordinates found on the graph provided for each...
Curated OER
Linear Programming
Students explore inequalities to determine the optimal solution to maximize a profit for a company. In this linear programming lesson plan, students discover how to graph inequalities and how to determine the algebraic representation of...
CK-12 Foundation
Linear Inequalities in Two Variables
Take the tediousness out of finding solutions of inequalities by graphing. Individuals use an interactive that allows them to adjust a system of inequalities on a coordinate plane. Using the interactive helps find solutions to systems of...
EngageNY
Interpreting Quadratic Functions from Graphs and Tables
Seeing functions in nature is a beautiful part of mathematics by analyzing the motion of a dolphin over time. Then take a look at the value of a stock and maximize the profit of a new toy. Explore the application of quadratics by...
Curated OER
Solving Inequalities
In this inequalities worksheet, learners solve and graph inequalities. They shade the answer region. Explanations and examples are provided at the beginning of the document. Answers are at the end of the worksheet. This four-page...
Other popular searches
- Inequalities Graph
- Linear Inequalities Graph
- Combined Inequalities Graph
- Solve and Graph Inequalities


