Curated OER
Transformations of a Quadratic Function
Students graph quadratic functions. In this algebra lesson, students perform transformation on the TI calculator as they create a visual. They identify the vertex and intercepts of the parabola.
Curated OER
"Ball Bounce" Quadratic Functions
Young scholars manipulate a ball and explore quadratic functions. In this algebra activity, students analyze the graph of a quadratic function. They identify quadratic properties.
Curated OER
Chronic Conics
Fourth graders use two activities to draw four different conic sections. One activity is of a physical nature and one is traditional paper and pencil.
Curated OER
Don't Fence Me In: Prisms
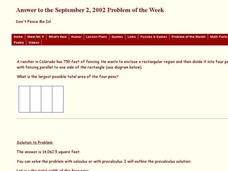
In this prism worksheet students explore the best way to divide a rectangular region into four areas using parallel lines. This one-page worksheet contains 1 problem. The answer is provided.
Curated OER
Technology - Chaos Theory Lab
Ninth graders gain an understanding of Chaos Theory that exists in one's everyday environment.
CPM
Unit 3, Worksheet 1, Exponents and Algebraic Expressions
Need exponentt practice? Then this exponent worksheet will be helpful to have learners evaluate exponent expressions and algebraic expressions. They use the distributive property to solve equations. This three-page worksheet contains...
Curated OER
How Has Math Evolved?
Eighth graders pick a topic or person to research related to the history of mathematics. They brainstorm and create a concept map, using the multimedia software inspiration, about what they are researching and want to examine. They then...
Varsity Tutors
Varsity Tutors: Hotmath: Graphing Calculator Practice Problems: Quadratic Equations
Practice using your graphing calculator for solving and graphing quadratic equations. If you get stumped or if you would like to check your work, then select the View Solution button, which is located directly under each problem.
Texas Education Agency
Texas Gateway: Analyzing the Effects of Changes in "A" on the Graph Y=ax^2 + C
Given verbal, graphical, or symbolic descriptions of the graph of y = ax^2 + c, the student will investigate, describe, and predict the effects on the graph when "a" is changed.
Texas Instruments
Texas Instruments: Transforming Parabolas
1. Students will be able to review how to find the vertex of a parabola using a graphing calculator. 2. Students will be able to observe the relationship between the values of a, h and k and the graph of a parabola in vertex form. 3....
Texas Instruments
Texas Instruments: Let's Play Ball With Families of Graphs
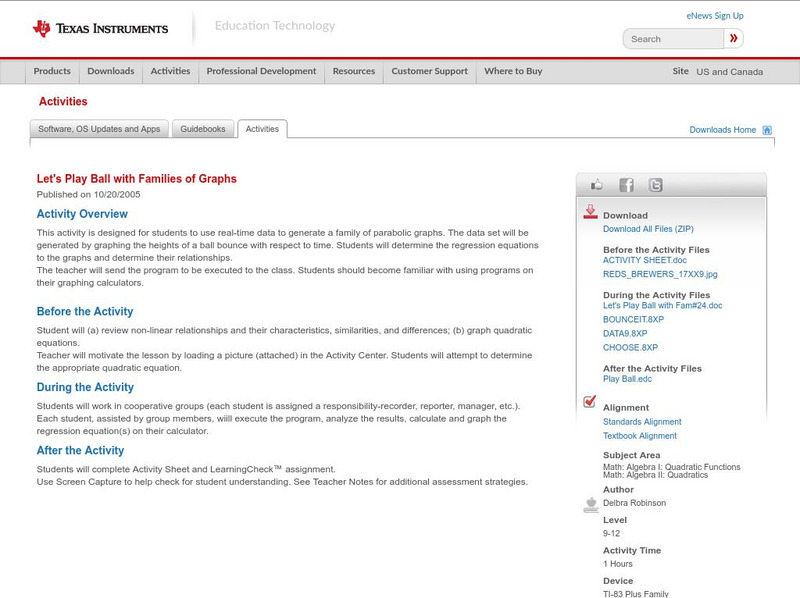
This activity is designed for students to use real-time data to generate a family of parabolic graphs. The data set will be generated by graphing the heights of a ball bounce with respect to time. Students will determine the regression...
Texas Instruments
Texas Instruments: Numb3 Rs: Fresh Air and Parabolas
Based off of the hit television show NUMB3RS, this lesson examines a plane crash, and gets students to try to find the location of various pieces of wreckage. This is done using parametric equations which form a parabolic trajectory....
Texas Instruments
Texas Instruments: Intersection of a Line With a Parabola
In this activity, students use Computer Algebra System (CAS) tools to find intersections of linear and non-linear equations. They confirm their answers by graphing the equations on the calculator.
ClassFlow
Class Flow: Quadratics Zeros
[Free Registration/Login Required] Graph parabolas and discover the zeros. Calculate the roots by factoring.
Texas Instruments
Texas Instruments: Parabolic Applications
Students will analyze a parabola graphed from word problems. Students can use the calculator to find the roots and vertex of the graph to answer questions based on the word problems.
Texas Instruments
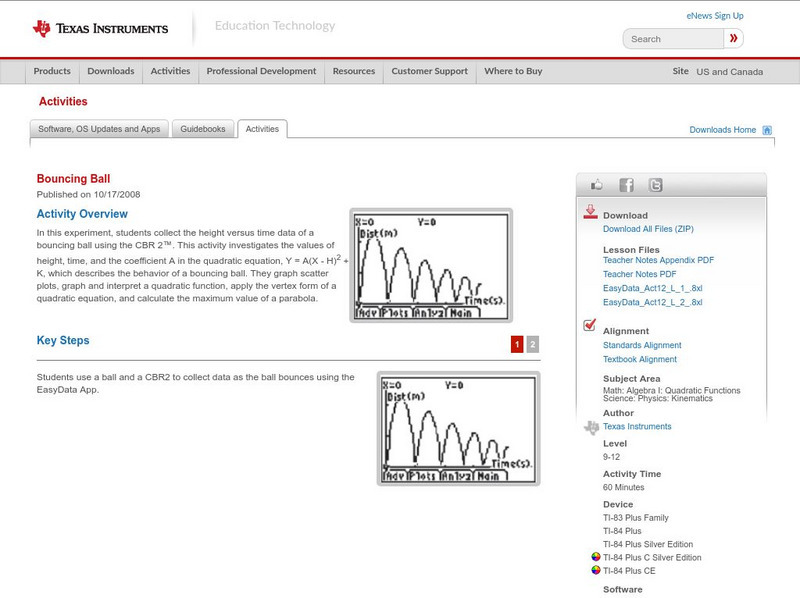
Texas Instruments: Bouncing Ball
In this experiment, students collect the height versus time data of a bouncing ball using the CBR 2. This activity investigates the values of height, time, and the coefficient A in the quadratic equation, which describes the behavior of...
Texas Instruments
Texas Instruments: Old Mac Donald's Pigpen
In this activity, students solve a standard maximum value problem using the calculator. Students help Old MacDonald build a rectangular pigpen with 40 m fencing that provides maximum area for the pigs. They graph scatter plots, analyze...
Texas Instruments
Texas Instruments: How High Will It Bounce?
In this activity, students collect the height versus time data of a bouncing ball using the CBR 2. They find the relationship between the bounce number and the bounce height. They learn to graph scatter plots, calculate the maximum value...
Texas Instruments
Texas Instruments: Exploring Standard Form of a Quadratic Function
Students explore y=ax^2+bx+c using the transform graphing application. Teacher calculator is used with Navigator to send device settings, the equation format and initial coefficient values to all students. Worksheet includes all student...


