Microsoft
Microsoft Education Lesson Plan: Candy Is Dandy
Explore color distribution of M&M candies using this detailed lesson plan. An engaging integrated lesson that requires understanding of spreadsheets and formulas, and logical reasoning. Links to related websites.
Texas Instruments
Texas Instruments: Gemini Candy
In this activity, students work in groups to collect data and draw conclusions from random samples simulated by drawing tiles from a bag. They represent the data collected in the form of a triple bar graph.
Texas Instruments
Texas Instruments: Numb3 Rs: Candy Land
Based off of the hit television show NUMB3RS, this lesson introduces students to the chi-squared statistical analysis. Although not completely in depth, the lesson does expose students to degrees of freedom, a simple chi-squared formula,...
Science Education Resource Center at Carleton College
Serc: Investigating Osmosis Using Water and Gummy Bears
For this biology classroom lab, students investigate the affect of soaking a Gummy Bear in water. They collect measurements of height, width, and mass before and after the soaking of the candy overnight. Students calculate % change for...
Texas Instruments
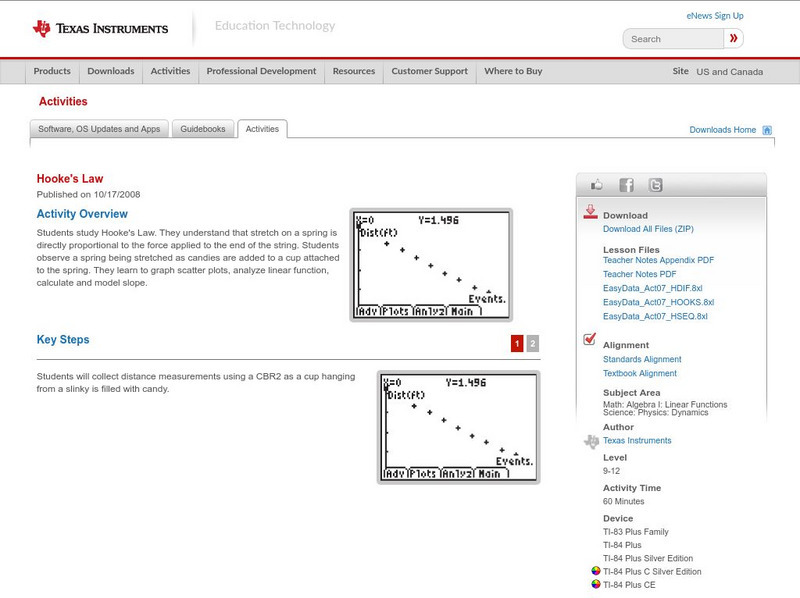
Texas Instruments: Hooke's Law
In this activity, students study Hooke's Law. They understand that stretch on a spring is directly proportional to the force applied to the end of the string. Students observe a spring being stretched as candies are added to a cup...
Other popular searches
- Halloween Candy Graphing
- Candy Sorting and Graphing
- Graphing Candy Corn
- Graphing Candy Hearts
- Math Graphing Candy Canes
- Candy Graphing
- Aims Candy Graphing
- Coordinate Graphing Candy
- Data Graphing Candy
- Candy Heart Graphing


