Curated OER
Candy Land Math
Students order numbers and sets of objects from 0 through 10 and organize and interpret information collected from the immediate environment. They read and interpret graphs usin real objects and the computer. Finally, students sort a...
Curated OER
Button Bonanza
Collections of data represented in stem and leaf plots are organized by young statisticians as they embark some math engaging activities.
Curated OER
Valentine Hearts Investigation
Students practice analyzing data and making predictions. In this 2nd - 3rd grade lesson plan, students investigate and compare data gathered using boxes of valentine candy hearts. Students examine the different boxes of candy provided,...
Curated OER
Coordinate Crunch
Learners identify plots on a graph while playing a game on a large coordinate grid and then on smaller grids.
Curated OER
Skittle Math
In this skittle math worksheet, students sort skittles by color and create a bar graph for each color of skittle. Students also answer comparison, ratio, and relationship questions about the skittles.
Curated OER
Spreadsheet Graphs
Students create graphs using information from spreadsheets. They select a topic from the following choices: website use, digital cameras, spreadsheets, calculators or educational software. They tally the class results and create an...
Curated OER
Candy is Dandy
Students view the benefits of using graphs to communicate information, answer questions and solve problems. They investigate color distribution in bags of M & M's. Working with actual bags of candy, they will sort and classify contents.
Curated OER
M&M’s Math Worksheet
Who knew you could cover prediction, histograms, fractions, decimals, data collection, and averages (mean, median, and mode) all with a bag of M&M's®? Here's a fantastic set of worksheets to help you make candy a mathematical journey...
Curated OER
Sorting Sweethearts
Learners categorize sweetheart candy by color or message. In this sorting and graphing activity, students collect data by sorting the candy and then diagram their results in a graph.
Curated OER
Tim and Pat - At the Store
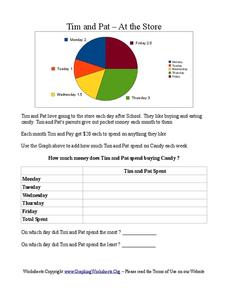
In this bar graphs worksheet, students use the bar graph to add how much time Tim and Pat spend buying candy each week. Students complete the table and answer 3 questions.
Curated OER
Tim and Pat - At the Store
In this pie chart worksheet, students use the pie chart to add the amount of time Tim and Pat spend buying candy each day of the week. Students answer 2 questions about the table.
Curated OER
Carbon Dating
Simulate C-14 decay using M&M and Reese's Pieces candies. In this scatter-plot lesson, students perform an experiment to simulate the half life of C-14. Information is plotted on a scatter-plot. Students answer four comprehension...
Curated OER
Candy Sorting
In this sorting worksheet, students sort, count and graph pieces of candy and chart their information on the worksheet. Teachers need to supply lemon, cherry and orange candy.
Curated OER
M&Ms Count and Crunch
Learners practice skills involving statistics and probability by making predictions on number of each color candy in one pound bag of M&Ms. They record both guesses and actual quantities, calculate percentages, and create bar graphs...
Curated OER
Yummy Math
Young mathematicians use bags of Skittles to help them gain practice in graphing and organizing data. They work in pairs, and after they have counted and organized their Skittles, they access a computer program which allows them to print...
Curated OER
Areology: The Study of Mars
Students use Oreo candy bars to explore how surface core samples call tell people about the history and make-up of Mars.
American Statistical Association
A Sweet Task
Candy is always an effective motivator! A fun math activity uses M&M's and Skittles to explore two-way frequency tables and conditional probability. The candy can serve a dual purpose as manipulatives and experimental data.
Curated OER
"Eggs-ploring" Math with Jellybeans
Learners work in pairs with a small bag of jellybeans to estimate the number of candies in their bags and then figure out how many groups of 10 jellybeans are contained in their bags. They then graph the information using a pictograph or...
Firelands Local Schools
Exponential Growth and Decay
How can you safely model exponential growth and decay? A hands-on activity uses candies to model not only exponential decay, but also exponential growth. Exponential equations are fitted by hand and by use of a calculator to the data...
Curated OER
Jelly Bean Math Activities
Using jelly beans as math manipulatives can be a tasty way to introduce and reinforce math concepts. Regardless of the time of year, candy can be used to excite learners and facilitate a wide variety of mathematical concepts.
Howard County Schools
Exponential Decay Exploration
How can you model exponential decay? Explore different situations involving exponential decay functions and decreasing linear functions by performing activities with MandM candy, popcorn kernels, and number cubes.
Texas State Energy Conservation Office
Investigation: Building a Parabolic-Trough Collector
Amateurs of alternative energy build a mini parabolic-trough solar energy collector and use it to heat water. Temperature is recorded over a three-minute period and the data is graphed and analyzed. Note that in order to paint aquarium...
Statistics Education Web
Population Parameter with M-and-M's
Manufacturers' claims may or may not be accurate, so proceed with caution. Here pupils use statistics to investigate the M&M's company's claim about the percentage of each color of candy in their packaging. Through the activity,...
Curated OER
Flavorful Spreadsheets
Students create a spreadsheet which includes a bar graph. They sort and classify information and use the average function on a spreadsheet. They research Skittles candy and summarize their findings on a spreadsheet.
Other popular searches
- Halloween Candy Graphing
- Candy Sorting and Graphing
- Graphing Candy Corn
- Graphing Candy Hearts
- Math Graphing Candy Canes
- Candy Graphing
- Aims Candy Graphing
- Coordinate Graphing Candy
- Data Graphing Candy
- Candy Heart Graphing


