Curated OER
Who Shares My Function?
Students differentiate between linear and quadratic functions. For this algebra lesson, students write equations of graphs and graph a function from an equation. They also move the graph around on the coordinate plane.
Curated OER
Graphs and Ellipses
Students explore linear graphs, the parabola and the rectangular hyperbola.
Curated OER
Lines, Rays, Line Segments, and Planes
Students are introduced to lines, rays, line segments and planes and study the differences between them. They also practice graphing lines, rays, line segments and planes
Curated OER
Linear Equations Data Tables
Students graph linear equations on a Cartesian plane. After describing data tables and their use, students explore how the information from a table can be used to create a line graph. They discuss reasons for plotting a minimum of...
Pennsylvania Department of Education
Classifying Figures on the Coordinate Plane
Fifth graders use estimation to solve word problems. In this fractions lesson, 5th graders decide whether or not an answer to a work problem is reasonable by applying their knowledge of fractions, decimals and estimation. This lesson...
Curated OER
Get the Picture?
Students show reflection, translation and rotation of a simple coordinate graph picture which they have created.
Curated OER
The Tale of Scale
Eighth graders, using a range of data, produce three bar graphs for various scales along the y-axis.
Curated OER
Charting Weight
Sixth graders record the weight of themselves and 3 family over a week, and then use that data to compile 2 bar graphs and 4 line graphs and answer a series of questions.
Curated OER
A Real Life Example of the Distance Formula
Students answer the following question: "Using the lines of latitude and longitude, what is the distance (in degrees) if you were to travel from NASA Dryden to NASA Ames?" They use the distance formula to find the distance (measured in...
Curated OER
Celebrating the Fourth of July!
Young scholars model projectile motion algebraically and graphically; and make predictions based on the quadratic algebraic model.
EngageNY
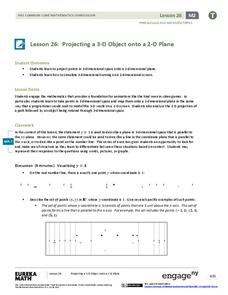
Projecting a 3-D Object onto a 2-D Plane
Teach how graphic designers can use mathematics to represent three-dimensional movement on a two-dimensional television surface. Pupils use matrices, vectors, and transformations to model rotational movement. Their exploration involves...
Curated OER
The Sum of Our Integer Intelligences
Young mathematicians explore integers. They review adding integers through engaging in mathematical labs. Each lab station is designed to reflect one of the multiple intelligences. Resources for all activities are provided.
EngageNY
The Graph of a Function
Mathematics set notation can be represented through a computer program loop. Making the connection to a computer program loop helps pupils see the process that set notation describes. The activity allows for different types domain and...
EngageNY
The Graph of the Equation y = f(x)
Math language? Set notation is used in mathematics to communicate a process and that the same process can be represented as computer code. The concept to the loop in computer code models the approach pupils take when creating a solution...
Curated OER
Ordered Pairs and Linear Systems
In this ordered pair and linear systems worksheet, students problem solve two equations involving ordered pairs and solving linear systems by graphing.
Curated OER
Worksheet 24
In this math worksheet, students work with three dimensional graphing. The application problems include surface ships on maneuvers determining a submarine's course, helicopter travel, and proving that four points are coplanar. Students...
Curated OER
The Way to Better Grades!
Pupils collect and analyze data. For this statistics lesson, learners create a scatter plot from their collected data. They use, tables and graphs to analyze the data and mae decisions.
Curated OER
When Am I Ever Going to Use this?
Students solve problems using equations and properties of integers. In this algebra lesson, students solve problems using ratio and proportion and graph their answers on a coordinate plane. They solve word problems using geometry.
Curated OER
Round and Round and Round We Go!
Students investigate motion using a CBL. For this algebra lesson, students collect and graph data on a coordinate plane. They define and identify amplitude and period of conic graphs.
Curated OER
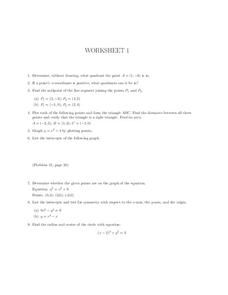
Worksheet 1, Coordinate Graphing
In this algebra worksheet, students determine the quadrant a given point is in. They find the midpoints of two line segments. Students plot points to form a triangle and find the distance between points. Students find the area of the...
Curated OER
Graphing With RXTE
Students use data from the Rossi X-ray Tiiming Explorer (RXTE) satellite to analyze and graph.
Curated OER
Growing Up With A Mission
Student measure heights and graph them using growth charts for which they find the mean, mode, and median of the data set. They graph points on a Cartesian coordinate system.
Alabama Learning Exchange
Creating a Reflection
Investigate geometric reflections in this geometry lesson. Create geometric reflections that show the reflection across the x and y axis of a coordinate graph. Learners watch a teacher demonstration before proceeding on their own. They...
Curated OER
Reflections
Tenth graders perform reflections on different geometric shapes. In this geometry worksheet,students define the concept of geometric reflections and find the coordinates of the reflection on a coordinate grid.


