Curated OER
Systems of Linear Inequalities 2
Students solve systems of inequalities. In this lesson, they identify the solution of the two lines and shade the solution. They identify the boundary line and the region representing the solution.
Curated OER
Finding and Graphing the Solution of an Inequality
In this Algebra/Algebra II worksheet, students find and graph the solution of an inequality. The two page worksheet contains a combination of eleven multiple choice and free response problems. Answers are provided.
Curated OER
Nonlinear Inequalities
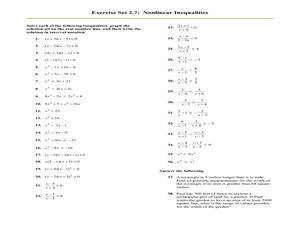
In this Algebra II worksheet, 11th graders solve nonlinear inequalities, graph the solution set on the number line, and write the solution in interval notation. The one page worksheet contains thirty-eight problems. Answers are provided.
Curated OER
Graph Logarithms
Mathematicians graph logarithmic equations. Teach your students how to identify the intercepts of logarithmic equations and tell whether the function is increasing or decreasing. They find the domain and range of each function.
Curated OER
Systems of Inequalities
In this algebra instructional activity, students solve systems of inequalities by graphing and shading the shared solution. There are 14 questions with an answer key.
Curated OER
Solving Systems of Inequalities
In this Algebra I/Algebra II instructional activity, students graph the solutions to a system of inequalities. The two page instructional activity contains ten problems. Answer key is provided.
Curated OER
Chapter 7. Functions and Graphs
In this functions and graphs worksheet, students determine the domain and range of a given relation. They graph functions on a coordinate plane and write equations in the slope-intercept form. This twelve page worksheet contains 30...
Curated OER
Linear Inequalities
Ninth graders explore solving linear inequalities. They discuss vocabulary words and symbols associated with linear inequalities. After a demonstration by the teacher, 9th graders solve and graph inequalities. Students complete a...
Curated OER
Doctor, Doctor, Give Me the News, I've Got a Bad Case of Loving Math
Solve a real-world problem of discovering how many doctors and nurses can be hired within budget and building constraints. Using different colored pencils to shade each graph, they then find the intersection points and use these to solve...
Curated OER
Solve Two Step Inequalities
In this algebra worksheet, students solve inequalities using addition, subtraction, multiplication and division. Answers to the 6 problems could also be graphed. An answer key is provided.
EngageNY
End-of-Module Assessment Task - Algebra 1 (Module 1)
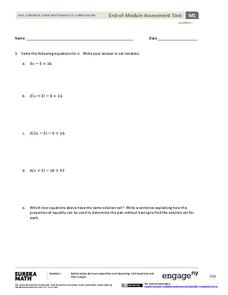
What do your young geniuses really know? Assess the procedural knowledge of your pupils at the same time as their higher-level thinking with an assessment that identifies their depth of knowledge. Topics include solving...
Inside Mathematics
Sorting Functions
Graph A goes with equation C, but table B. The short assessment task requires class members to match graphs with their corresponding tables, equations, and verbalized rules. Pupils then provide explanations on the process they used to...
Inside Mathematics
Squares and Circles
It's all about lines when going around. Pupils graph the relationship between the length of a side of a square and its perimeter. Class members explain the origin in context of the side length and perimeter. They compare the graph to the...
NOAA
A Matter of Density
Larvae transportation on the New England seamounts is based on the density of the water. Scholars calculate density and graph salinity versus temperature to better understand the distribution of organisms in a water column. Discussions...
Noyce Foundation
Granny’s Balloon Trip
Take flight with a fun activity focused on graphing data on a coordinate plane. As learners study the data for Granny's hot-air balloon trip, including the time of day and the distance of the balloon from the ground, they practice...
Chicago Botanic Garden
Plant Phenology Data Analysis
Beginning in 1851, Thoreau recorded the dates of the first spring blooms in Concord, and this data is helping scientists analyze climate change! The culminating instructional activity in the series of four has pupils graph and analyze...
Curated OER
Reading Tally Charts #2
Keep count with tally marks! First graders practice reading tally marks with this straightforward learning exercise. They work with interpreting data from a chart, as well as working with addition and subtraction under 20. A great math...
University of Colorado
Spacecraft Speed
Space shuttles traveled around Earth at a speed of 17,500 miles per hour, way faster than trains, planes, or automobiles travel! In the 13th installment of 22, groups graph different speeds to show how quickly spacecraft move through...
Balanced Assessment
Two Solutions
An assessment presents a variety of equations and inequalities. Pupils must find two solutions for each equation or inequality and determine whether there are only two, another finite number, or an infinite number of solutions for the...
Virginia Department of Education
Nonlinear Systems of Equations
Explore nonlinear systems through graphs and algebra. High schoolers begin by examining the different types of quadratic functions and their possible intersections. They then use algebraic methods to solve systems containing various...
Inside Mathematics
Party
Thirty at the party won't cost any more than twenty-five. The assessment task provides a scenario for the cost of a party where the initial fee covers a given number of guests. The class determines the cost for specific numbers of guests...
Fredonia State University of New York
Watch Your Step…You May Collide!
Can two lines intersect at more than one point? Using yarn, create two lines on the floor of the classroom to find out. Cooperative groups work through the process of solving systems of equations using task cards and three different...
Mascil Project
Epidemics: Modelling with Mathematics
The Black Death epidemic is responsible for more than one million deaths in the United Kingdom. An inquiry-based activity has young scholars explore the rate of disease spread. They then analyze graphs showing data from epidemics such as...
EngageNY
Mid-Module Assessment Task: Grade 7 Mathematics Module 3
Lesson 16 in the series of 28 is a mid-module assessment. Learners simplify expressions, write and solve equations, and write and solve inequalities. Most questions begin as word problems adding a critical thinking component to the...
Other popular searches
- Inequalities Graphing
- Math Graphing Inequalities
- Inequalities and Graphing
- Algebra Graphing Inequalities


