Shodor Education Foundation
Data Flyer
Fit functions to data by using an interactive app. Individuals plot a scatter plot and then fit lines of best fit and regression curves to the data. The use of an app gives learners the opportunity to try out different functions to see...
Curated OER
Worksheet 24
For this math worksheet, students work with three dimensional graphing. The application problems include surface ships on maneuvers determining a submarine's course, helicopter travel, and proving that four points are coplanar. Students...
Curated OER
Match My Masterpiece
Fifth graders plot out points on grid paper which correspond with the ordered pairs they are given. If done correctly, the points form a word.
Curated OER
Make a Design by Plotting Points
Students plot points on graph paper to make designs. They color their designs.
Curated OER
A Christmas Project
Seventh graders publish a letter and spreadsheet using the computer. They build a three-dimesnsional object with construction paper and develop a Christmas object using coordinates on a graph. Students compose a response in their journals.
Curated OER
Parabolas
Students find equations of parabolas in real world scenarios. In this finding equations of parabolas in real world scenarios lesson, students find the equations of parabolas of US landmarks. Students put a grid on landmarks such as the...
Curated OER
Linear & Quadratic Functions: Solving Graphically
In this linear and quadratic function worksheet, students examine and solve a system of equations. They graph each function on a coordinate plane. This one-page worksheet contains ten problems.
Curated OER
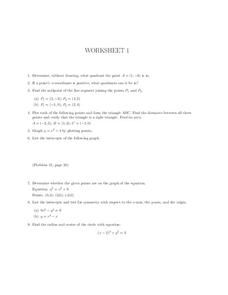
Worksheet 1, Coordinate Graphing
In this algebra worksheet, students determine the quadrant a given point is in. They find the midpoints of two line segments. Students plot points to form a triangle and find the distance between points. Students find the area of the...
Curated OER
Spaghetti Bridges: Student Worksheet
Here is a wonderful activity that allows young engineers to try their hand at designing a bridge out of spaghetti! The learning exercise explains the activity and also provides a graph for keeping track of the results. Very good!
Curated OER
Graphing With RXTE
High schoolers use data from the Rossi X-ray Tiiming Explorer (RXTE) satellite to analyze and graph.
Curated OER
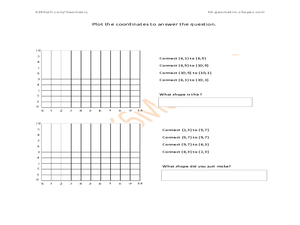
Plotting Coordinates #2
In this plotting coordinates instructional activity, students plot sets of coordinates on graphs, then name the shape the plots formed. A reference web site is given for additional activities.
Curated OER
Plot the Coordinates
In this plotting coordinates worksheet, students plots sets of coordinates on graphs, then identify the shape the connected points have created. A reference web site is given for additional activities.
Curated OER
Inequalities and Measures of Central Tendency
In this inequality and measures of central tendency worksheet, students solve and graph linear inequalities. They organize given data to identify the mean, mode and range. Students interpret box-and-whisker plots. This three-page...
Curated OER
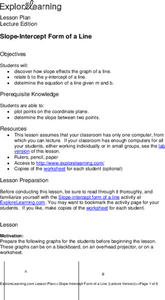
Slope-Intercept Form of a Line
High schoolers determine how the slope affects the graph of a line. They relate "b" to the "y"-intercept of a line and solve the equation of a line given "m" and "b." They are given scenarios and possible answers to which they explain...
Curated OER
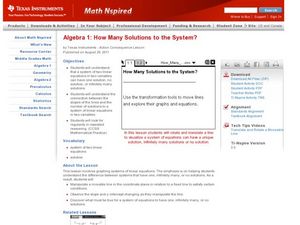
How Many Solutions to the System?
Solve systems of equation using graphing! In this algebra activity, learners use the TI to graph two lines and identify the number of solutions. They perform interactive graphing on the navigator.
Curated OER
Let's Go Slopey
Students create a table of values to graph a line. In this algebra instructional activity, students identify the slope and intercept of a linear equation. They use a Ticalculator to graph their function.
Curated OER
VARIABLES AND PATTERNS, USE AFTER INVESTIGATION THREE. DISCRETE OR CONTINUOUS LINEAR RELATIONS.
Learners discover for which kind of linear function is appropriate to use the "scatter" or the "connected" term. In this instructional activity, students investigate functions using variables, patterns book, graph paper, rulers and the...
Houghton Mifflin Harcourt
Unit 4 Math Vocabulary Cards (Grade 6)
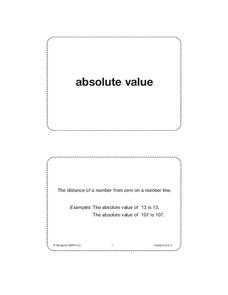
Reinforce math vocabulary with a set of flash cards. Forty-eight cards offer boldly printed words, and their corresponding definition alongside an example with labels. Terms include absolute value, inverse operations, slope, and more!
Curated OER
Taking Its Toll
Young scholars explore ratios. For this rates lesson plan, students create a ratio to compare the price of a toll to the distance travelled. They compute the average cost per mile, determine the slope between two ordered pairs, and make...
Curated OER
Practice: Word Problems
Congratulations, you've just hit the word problem jackpot! Covering an incredible range of topics from integers and fractions, to percents, geometry, and much more, this collection of worksheets will keep young mathematicians busy...
Balanced Assessment
Para-Ball-A
Analyze the flight of a thrown ball. Learners determine the maximum height of a thrown ball and the time it takes to hit the ground given its initial speed. They continue to review different scenarios with different maximums or different...
Shodor Education Foundation
Simple Maze Game
Avoid the mines and win the game! Young scholars direct a robot through a minefield by plotting points. Their goal is to reach the target in as few moves as possible.
EngageNY
Examples of Dilations
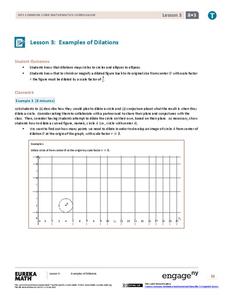
Does it matter how many points to dilate? The resource presents problems of dilating curved figures. Class members find out that not only do they need to dilate several points but the points need to be distributed about the entire curve...
Curated OER
Graphs And Ellipses
Learners become acquainted with linear graphs, the parabola and the rectangular hyperbola. Also prepare tables of paired values as preparation for plotting a line. They study the cartesian equation of an ellipse, with a worked example.


