Virginia Department of Education
Transformation Investigation
Graph it! Investigate transformations with a graphing calculator. Pupils graph sets of linear functions on the same set of axes. They determine how changes in the equation of a linear function result in changes in the graph.
Curated OER
Building a Quadratic Function Form
Comparing the movement of graphs geometrically when small changes are made to the parent function motivates this collaborative discussion on the transformations of functions to their various forms. Vertical and horizontal shifts due to...
Curated OER
Dilations and Similarity
In this dilations and similarity worksheet, pupils solve 10 different problems that include various dilations. First, they determine the scale factor of dilations found in the illustrated graphs. Then, everyone determines the coordinates...
Curated OER
Vertical and Horizontal Translations
Students analyze function graphs. In this Algebra II/Pre-calculus lesson, students investigate the graph of a function as they determine to which family of functions it belongs, determine the parent function and describe the translation...
Curated OER
Translations and Scale Changes
Students perform translation and transformation of functions. For this algebra lesson, students write the formula for the different transformation and graph given translation. They compare the change to the parent function.
Curated OER
Computer Graphing Calculator Explorations
Students explore the graphing calculator feature on the Macintosh computer to explore some "parent" functions and their translations, combinations, and composites.
Curated OER
Translations
Students perform translations on different polygons. In this geometry instructional activity, students create figures that will be used as an assessment to represent transformation. They perform hands on creation and relate it to the...
Curated OER
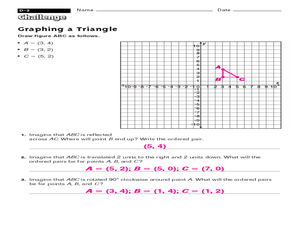
Graphing a Triangle
In this geometry skills worksheet, students graph a triangle using the provided information and then respond to 3 short answer questions regarding it.
Curated OER
Graphing Regions: Lesson 2
Students identify and analyze geographical locations of inventors. They each identify where their inventor is from on a U.S. map, discuss geographic patterns, and create a t-chart and graph using the Graph Club 2.0 Software.
Curated OER
Graphing Square Root
In this algebra worksheet, students graph square root functions. They use translation to move the graph around. There are 4 questions with an answer key.
Curated OER
Writing Equations of Parabolas in Vertex Form
Pupils use their knowledge of the vertex form of a quadratic equation to graph parabolas using a graphing calculator, given a specific move to make. this lesson may be used as a review or as extra practice, in groups or individually.
Curated OER
The Hudson's Ups and Downs
Fifth graders practice interpreting line graphs of the Hudson River water levels to assess the tides and tidal cycles in the estuary. They explore how weather can affect water levels and tides and observe that high tides and low tides...
Pennsylvania Department of Education
Use Order of Operations to Evaluate Expressions—No Grouping Symbols
Students identify and explain different types of data collection and graphs. For this graphs and data collection lesson, students record their observations of a variety of data collection tools and graphs displayed in the room. Students...
Pennsylvania Department of Education
Equal Groups
Students explore statistics by completing a graphing activity. In this data analysis lesson, students define a list of mathematical vocabulary terms before unpacking a box of raisins. Students utilize the raisins to plot data on a line...
Curated OER
Determining the Number of Wavelengths
After displaying three diagrams showing 1, 1 1/2, and 2 wavelengths, the slide show presents more diagrams and expects pupils to determine the number of wavelengths in each. No labels or explanations are provided, so this would be useful...
Curated OER
Four Graphs of Transformations Problems
In this transformations worksheet, students sketch transformations of given graphs in four problems. In one of these problems students match graphs to equations.
West Contra Costa Unified School District
Introduction to Solving Linear Inequalities in One Variable
Life isn't fair ... like inequalities. After first reviewing inequality symbols and how to read inequality statements, learners discover how to solve one-step inequalities and graph their solution sets.
EngageNY
Transformations of the Quadratic Parent Function
Efficiently graph a quadratic function using transformations! Pupils graph quadratic equations by completing the square to determine the transformations. They locate the vertex and determine more points from a stretch or shrink and...
Inside Mathematics
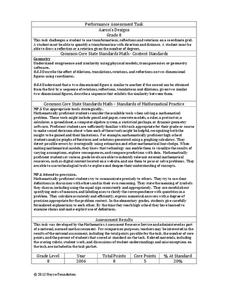
Aaron's Designs
Working with transformations allows the class to take a turn for the better. The short assessment has class members perform transformations on the coordinate plane. The translations, reflections, and rotations create pattern designs on...
Virginia Department of Education
Transformations
Geometry in life-sized dimensions! Using enlarged graph paper, pupils perform a series of transformations. By recording the initial and final placement of the images, they are able to analyze the patterns in the coordinates during a...
Willow Tree
Transformations
How does something go from here to there? Describe it with a transformation. Young mathematicians learn how to translate, reflect, rotate, and dilate an image.
Concord Consortium
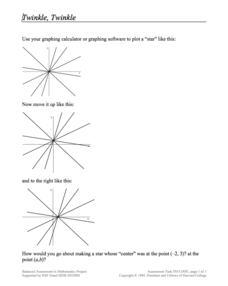
Twinkle, Twinkle
Take a look at a star resource. Young mathematicians use a graphing calculator to draw intersecting lines that look like a star. They then apply translations to move the entire star and also consider what transformations must occur to...
Curated OER
Transformations in the Coordinate Plane
Your learners connect the new concepts of transformations in the coordinate plane to their previous knowledge using the solid vocabulary development in this unit. Like a foreign language, mathematics has its own set of vocabulary terms...
EngageNY
The Height and Co-Height Functions of a Ferris Wheel
Show learners the power of mathematics as they model real-life designs. Pupils graph a periodic function by comparing the degree of rotation to the height of a ferris wheel.


