Illustrative Mathematics
Favorite Ice Cream Flavor
What better way to engage children in a math instructional activity than by talking about ice cream? Using a pocket chart or piece of chart paper, the class works together creating a bar graph of the their favorite ice cream flavors....
Mathematics Assessment Project
Ice Cream
I scream, you scream, we all determine the amount of ice cream! Pupils calculate the amount of ice cream flavors needed based on survey results in a short summative assessment. They determine the number of tubs and cost of ice cream to...
Bowland
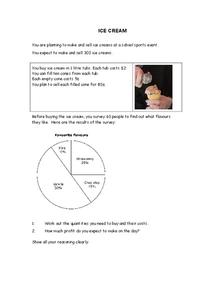
Ice Cream
Make sure there is enough ice cream on hand. Learners try to find out how much ice cream to buy for a sports event. Scholars use a pie chart showing the percent of a sample of people who like different flavors of ice cream. Using the...
Alabama Learning Exchange
Ice Cream Sundae Survey
Young scholars analyze data through graphs. They will complete a class survey on ice cream sundaes and tally and graph the responses. They then analyze the information from the class graph.
Curated OER
Ice Cream Lab
This very thorough lesson plan has learners collect all ingredients necessary and work in pairs to make ice cream using plastic bags. They take temperature readings and record them on the chart as well as record findings on the...
Curated OER
Ice Cream Lab
I scream, you scream, we all scream for ice cream! Even high schoolers enjoy making ice cream. This laboratory exercise has them record the temperature changes throughout the process of liquid becoming solid, graph the results, and...
Curated OER
Which Flavor of Ice Cream Do You Like Best?: Graph
In this favorite ice cream bar graph worksheet, students will ask their classmates which flavor is their favorite: vanilla, chocolate, mint, strawberry or chocolate chip? Then students will record the responses to complete the graph.
Curated OER
Using Bar Graphs
What's your favorite pizza topping? Scholars analyze two bar graphs, one depicting a math club's favorite pizza toppings and the other ice cream sales per flavor. As they examine the graphs, learners answer a few comprehension questions....
Curated OER
Simple Tally Charts and Bar Graphs
Introduce your first graders to the world of tally marks, bar graphs, and the organization of data. Pupils determine a favorite ice cream flavor based on tally marks, then use a bar graph to answer some questions about sports. There are...
Curated OER
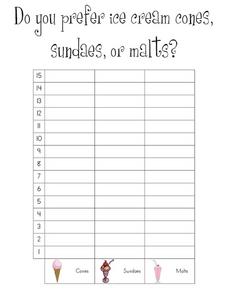
Do You Prefer Ice Cream Cones, Sundaes, Or Malts?: Graph
In this favorite ice cream bar graph worksheet, students will ask their classmates how they prefer their ice cream and record the responses to complete the graph.
Curated OER
What's the Scoop?: Our Favourite Ice Cream Flavours
Sixth graders create a spreadsheet on the favorite ice cream flavors of their peers. They interview their classmates, documenting their findings on a "Favorite Flavors" spreadsheet. Students graph and analyze the data.
CK-12 Foundation
Multiple Bar Graphs
I scream, you scream, we all scream for ice cream bar graphs. Pupils create a multiple bar chart to represent the sales of ice cream products during the first week of summer. Using the chart, learners find the day that each of the...
Curated OER
The Ice Cream Shop
Second graders read books about ice cream and plan an ice cream sundae party for the class. They research ingredients and determine how much the party cost each student. They hold a mock opening for an ice cream store and have their party.
Curated OER
Making Ice Cream
Student examine the physical changes of matter and are able to describe them. They make ice cream in plastic bags to observe the changes in matter. They describe and record the changes in the ice cream mixture as it freezes.
Curated OER
Ice Cream Pictograph
Students create a graph. In this pictograph lesson plan, students cut out 20 small ice cream cones and decorate them. Students create a pictograph with their ice cream cones.
Worksheet Web
Using Pictographs
If one ice cream cone represents three ice cream scoops, and Bob has four ice cream cones, then how many scoops does Bob have? Learners solve these kind of questions with their new understanding of pictographs.
K12 Reader
Showing Data on a Graph
Here's a learning exercise that not only introduces kids to graphing, but also is designed as a reading comprehension activity. After reading the article about graphing, kids respond to a series of questions based on the article.
Curated OER
Ice Cream Scoop
For this data display worksheet, students write 6 flavors of ice cream on pieces of paper. Students choose papers one at a time and keep track on a tally sheet. Students make a bar graph of the results.
Curated OER
Pictographs
What do these pictographs show? Scholars analyze three sets of data organized into pictographs, filling in several comprehension questions about each. The first one is done for them as an example, but consider going over it together to...
Curated OER
The Ice Cream Stands Problem
Tenth graders pretend to set up an ice cream shop in a make believe town of shapes. In this geometry lesson plan, 10th graders work together to put up an ice cream stand in an ideal location and solve for the minimum given the shapes.
Curated OER
Ice Cream Toppings
Students explore the five senses. In this senses lesson, students use their senses to top their ice cream. Students compare and contrast the different toppings and write their observations, using descriptive words, in a notebook.
Curated OER
Choose a Graph to Display Data
In this math graphs worksheet, students write line plot, tally chart, pictograph, or bar graph to tell the best kind of graph to use to answer the six questions.
Curated OER
Graphing
Intended for a faith-based classroom, this lesson requires second graders to create a survey, conduct the survey in multiple classrooms, and graph the results. They can choose between creating a picture or bar graph, or you can require...
Curated OER
Circle Graphs
In this circle graphs worksheet, learners solve and complete 8 different problems that include word problems referring to two different circle graphs shown. First, they follow the directions for each problem and complete the table that...


