Curated OER
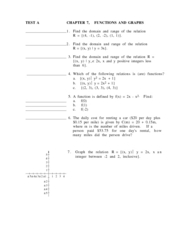
Chapter 7. Functions and Graphs
In this functions and graphs worksheet, students determine the domain and range of a given relation. They graph functions on a coordinate plane and write equations in the slope-intercept form. This twelve page worksheet contains 30...
Curated OER
Solving Compound Inequalities
In this compound inequalities worksheet, students solve and graph 12 different problems that include compound inequalities. First, they graph the solution of each compound inequality. Then, students write a compound inequality for each...
Curated OER
Solve Two Step Inequalities
In this algebra worksheet, students solve inequalities using addition, subtraction, multiplication and division. Answers to the 6 problems could also be graphed. An answer key is provided.
Virginia Department of Education
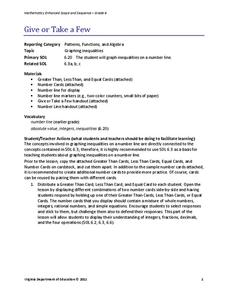
Give or Take a Few
Young mathematicians extend their knowledge of rational numbers on a number line to graph inequalities by first using number cards to compare rational numbers. They finish by using similar reasoning to graph inequalities on a number line.
EngageNY
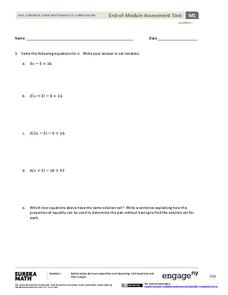
End-of-Module Assessment Task - Algebra 1 (Module 1)
What do your young geniuses really know? Assess the procedural knowledge of your pupils at the same time as their higher-level thinking with an assessment that identifies their depth of knowledge. Topics include solving...
Inside Mathematics
Sorting Functions
Graph A goes with equation C, but table B. The short assessment task requires class members to match graphs with their corresponding tables, equations, and verbalized rules. Pupils then provide explanations on the process they used to...
Inside Mathematics
Squares and Circles
It's all about lines when going around. Pupils graph the relationship between the length of a side of a square and its perimeter. Class members explain the origin in context of the side length and perimeter. They compare the graph to the...
NOAA
A Matter of Density
Larvae transportation on the New England seamounts is based on the density of the water. Scholars calculate density and graph salinity versus temperature to better understand the distribution of organisms in a water column. Discussions...
Noyce Foundation
Granny’s Balloon Trip
Take flight with a fun activity focused on graphing data on a coordinate plane. As learners study the data for Granny's hot-air balloon trip, including the time of day and the distance of the balloon from the ground, they practice...
Chicago Botanic Garden
Plant Phenology Data Analysis
Beginning in 1851, Thoreau recorded the dates of the first spring blooms in Concord, and this data is helping scientists analyze climate change! The culminating instructional activity in the series of four has pupils graph and analyze...
University of Colorado
Spacecraft Speed
Space shuttles traveled around Earth at a speed of 17,500 miles per hour, way faster than trains, planes, or automobiles travel! In the 13th installment of 22, groups graph different speeds to show how quickly spacecraft move through...
Balanced Assessment
Two Solutions
An assessment presents a variety of equations and inequalities. Pupils must find two solutions for each equation or inequality and determine whether there are only two, another finite number, or an infinite number of solutions for the...
Virginia Department of Education
Nonlinear Systems of Equations
Explore nonlinear systems through graphs and algebra. High schoolers begin by examining the different types of quadratic functions and their possible intersections. They then use algebraic methods to solve systems containing various...
Inside Mathematics
Party
Thirty at the party won't cost any more than twenty-five. The assessment task provides a scenario for the cost of a party where the initial fee covers a given number of guests. The class determines the cost for specific numbers of guests...
Fredonia State University of New York
Watch Your Step…You May Collide!
Can two lines intersect at more than one point? Using yarn, create two lines on the floor of the classroom to find out. Cooperative groups work through the process of solving systems of equations using task cards and three different...
Mascil Project
Epidemics: Modelling with Mathematics
The Black Death epidemic is responsible for more than one million deaths in the United Kingdom. An inquiry-based activity has young scholars explore the rate of disease spread. They then analyze graphs showing data from epidemics such as...
PBS
Data Plots of Exoplanet Orbital Properties
Scientists discovered the first exoplanet in 1995 and by early 2018, they confirmed the existence of more than 3,700—that's a lot of data! As part of the PBS 9-12 Space series, scholars interpret data about exoplanets. They compare...
Curated OER
Chapter 2 Practice Test
In this algebra worksheet, students examine and graph linear equation, inequalities, and absolute value inequalities in two variables. The three page worksheet contains forty-six problems. Answers are not included.
Curated OER
Solving Compound Inequalities
For this compound inequalities worksheet, 9th graders solve and complete 7 different problems that include graphing various inequalities on a number line given. First, they graph the solution set of each compound inequality. Then,...
Curated OER
Systems of Linear Inequalities
In this Algebra I/Algebra II worksheet, students solve systems of linear inequalities by graphing the inequalities on a coordinate plane and determining the location of all ordered pairs that solve the system. The three page worksheet...
Curated OER
Graphing Systems of Inequalities
In this systems worksheet, students solve 6 systems of inequalities by graphing. Students then write 1 systems of inequalities for a given graph.
Curated OER
Equations and Inequalities
Students in a college algebra class use graphs to solve inequalities. Using the coordinate graphing system, they represent the relationship between x and y intercepts. They practice solving equations with complex numbers and locate...
Curated OER
Using Inequalities to Problem Solve
Students explore inequalities. For this Algebra I lesson, students solve and graph linear inequalities involving addition, subtraction, multiplication, or division. Students use inequalities to solve and graph real-world problems.
Curated OER
Compound Inequalities
Pupils solve problems with compound inequalities. In this algebra instructional activity, students solve inequalities using addition, subtraction, multiplication and division. They graph-their solutions on a numbers line.
Other popular searches
- Graphing Linear Inequalities
- Graphing Inequalities
- Math Graphing Inequalities
- Graphing Compound Inequalities
- Algebra Graphing Inequalities


