Curated OER
Comparison of Two Different Gender Sports Teams - Part 1 of 3 Measures of Central Tendency
Students gather and analyze data from sports teams. In this measures of central tendency lesson, students gather information from websites about sports team performance. Students analyze and draw conclusions from this data. This lesson...
Curated OER
Modeling Population Growth
Students collect data on population growth. In this statistics lesson, students graph their data and make predictions. They find the linear regression and the best fit line.
Curated OER
Building a Pill Bug Palace
Students make "pets" of isopods (potato bugs) to determine their preferred environment and food sources. They record their results on a bar graph and in a scientific report.
Curated OER
Linear Patterns in Data
Eighth graders extend their learning of graphing linear equations and are introduced to connecting patterns in tables and graphs to represent algebraic representations. They then determine patterns and extrapolate information from these...
Curated OER
Model Data with Quadratic Functions
Students model data using quadratic equations. In this algebra lesson, students simplify and factor quadratic equations. They graph the function using collected data and analyze the parabola.
Curated OER
The Environment and Interactions of Living Organisms
Young scholars study the environment and interactions of living organisms. They identify abiotic and biotic factors and create a foldable and vocabulary cards. They create a poster illustrating soil and watch a video to study symbiosis.
Curated OER
Linear Modeling: Functions
Students analyze linear functions. In this algebra lesson, students create a linear model to relate coordinate pairs. They evaluate and solve equations.
Curated OER
The Box Problem
Students create graphic, algebraic and verbal ideas of functions. In this algebra lesson, students graph functions and identify the zeros of the functions. They find the domain and range and classify functions as relation or not.
Curated OER
What's The Point?
Students solve word problems using the correct math symbols. In this algebra lesson, students use the TI calculator to graph their equation and analyze it. They find the line of regression and use to draw conclusion.
Curated OER
Finding Equations
Learners make equations from everyday data. They create a graph from the equations. Students predict and analyze the results. Learners complete the second scenario on their own and turn in their handout.
Curated OER
How can my breakfast help the birds?
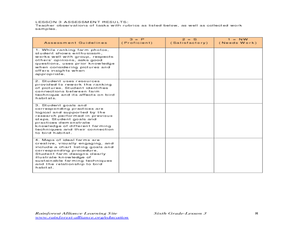
Sixth graders design farms with a bird's habitat in mind. In this farm lesson plan, 6th graders research how sun grown coffee destroys a bird habitat, and then they make their own farm with a bird's habitat being preserved. They then...
Curated OER
Lesson Plan On Fran Data
Seventh graders investigate the concept of functions and how they are used in the context of the real world while identifying the dependent and independent variables. They graph relations and functions and find the zeros of functions....
Curated OER
Lesson Plan for Fontana Mines
Students estimate and compute with rational numbers. They compare, order and convert among fractions, decimals and percents. Students analyze problems to determine if there is sufficient or extraneous data to solve.
Curated OER
Introduction to Science
Seventh graders investigate scientific methods to solve problems. They demonstrate creating data tables and graphs. They study the role of a scientist and the importance of safety in a science lab. They distinguish between an...
Curated OER
Whose Breakfast isn't for the Birds?
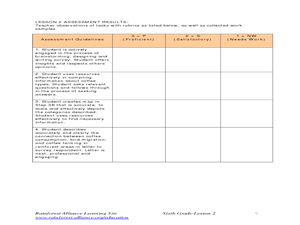
Students explore coffee production. For this cross-curriculum rainforest ecology lesson, students research regions where coffee comes from and investigate how the native birds in the rainforest are effected by coffee production. ...
Other
Nearpod: Construct & Interpret Scatter Plots
In this lesson plan on scatter plots, 8th graders will learn how to interpret scatter plots and then graph them using a data table.
Math Is Fun
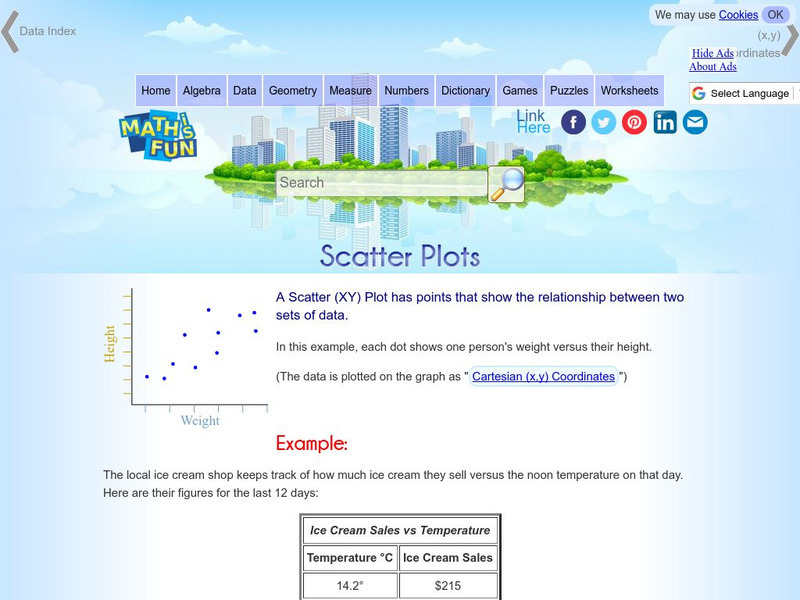
Math Is Fun: Scatter Plots
Explains, with examples, what scatter plots are and how to interpret the data. Discusses trends, interpolation and extrapolation, and correlation. Includes a set of practice questions.
Khan Academy
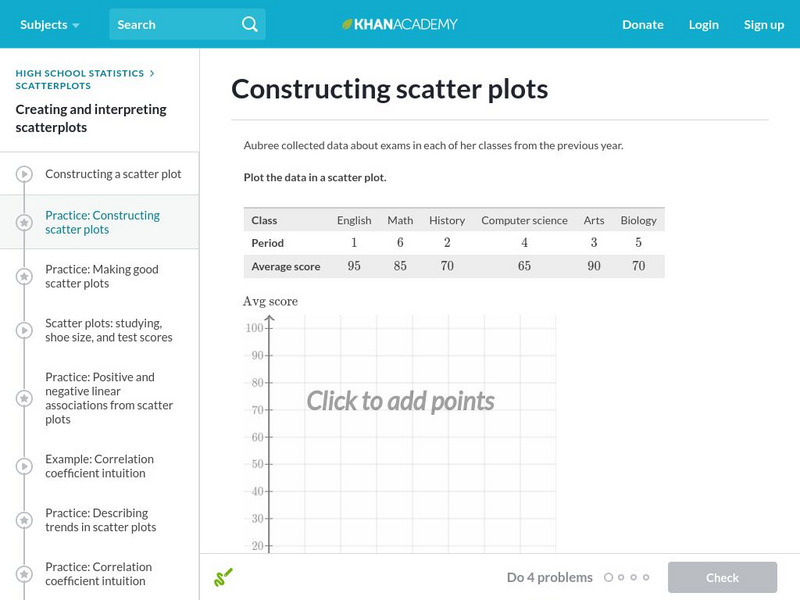
Khan Academy: Constructing Scatter Plots
Practice plotting points to construct a scatter plot. Students receive immediate feedback and have the opportunity to try questions repeatedly, watch a video, or receive hints.
Khan Academy
Khan Academy: Review: Outliers in Scatter Plots
Learn about the points that don't fit the pattern in a scatter plot with this article. Site also includes practice questions to test your knowledge of the topic.
Khan Academy
Khan Academy: Describing Trends in Scatter Plots
Practice making sense of trends in scatter plots. That is, explain what trends mean in terms of real-world quantities. Students receive immediate feedback and have the opportunity to try questions repeatedly, watch a video, or receive...
Khan Academy
Khan Academy: Review: Clusters in Scatter Plots
An article that discusses what we mean when we talk about clusters in scatter plots. It also includes practice questions that test your knowledge of the topic.
Khan Academy
Khan Academy: Positive and Negative Linear Associations From Scatter Plots
Practice identifying the types of correlations shown in scatter plots. Sometimes we see linear correlations (positive or negative), sometimes we see non-linear correlations (the data seems to follow a curve), and other times we don't see...
Khan Academy
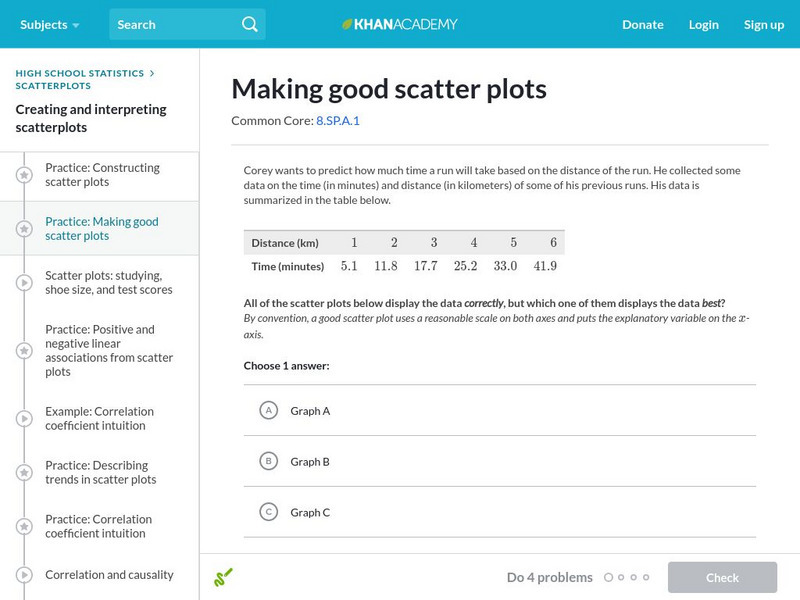
Khan Academy: Making Good Scatter Plots
A good scatter plot has the independent variable on the x-axis and the dependent variable on the y-axis. Also, the scale of both axes should be reasonable, making the data as easy to read as possible. In these practice problems, we...
Texas Instruments
Texas Instruments: Birthday Scatter Plot
Students will be able to interpret a scatter plot to see if there is a relationship between the two variables.


