Curated OER
Educational Technology Clearinghouse: Maps Etc: Europe (Physical), 1868
A map from 1868 of Europe, showing the physical features, climate, and commercial resources of the region. Mountain chains are represented by lines of varying thickness, with the broader the line, the greater the elevation. The highest...
Curated OER
Educational Technology Clearinghouse: Maps Etc: Physical Map of Europe, 1916
A physical map of Europe from 1916 showing color-coded elevations and water depths for the area extending from Iceland to the natural boundary between Europe and Asia (Ural Mountains to the Caspian Sea), and the Arctic Circle to the...
Curated OER
Educational Technology Clearinghouse: Maps Etc: Ireland Climate, 1920
A climate map of Ireland in 1920 showing the average annual rainfall in inches, January and July isotherms in degrees Fahrenheit, and prevailing wind direction.
Curated OER
Educational Technology Clearinghouse: Maps Etc: Mexico, 1902
A map from 1902 of Mexico showing the states and state capitals, major cities and towns, trunk and secondary railroad lines, mountains, and coastal features. This map shows isotherms of mean annual temperature in degrees Fahrenheit, and...
Curated OER
Educational Technology Clearinghouse: Maps Etc: North America, 1901
A map from 1901 of North America, Central America, the Caribbean, and Greenland showing general land elevations, mountain systems, rivers, coastal features, and ocean currents. The map is color-coded to show land elevations ranging from...
Curated OER
Educational Technology Clearinghouse: Maps Etc: North America, 1868
A map from 1868 of North America, Central America, and the Caribbean showing the physical features of the region, vegetation types, ocean currents, temperatures, principal products and mineral deposits. Mountain chains are represented by...
Curated OER
Etc: Maps Etc: Heat Belts in North America, 1898
A map from 1898 showing the heat belts in North America. The map gives the boundary isotherms of the hot belt as a mean temperature of 70 degrees Fahrenheit and the cold belt as a mean temperature of 30 degrees Fahrenheit, indicating the...
Curated OER
Etc: Maps Etc: West Indies and Central America, 1872
A map from 1872 of the West Indies and Central America. The map shows political boundaries at the time, capitals, major cities, and ports, railroads, main steamship routes, rivers, terrain and coastal features, and banks. The map shows...
Curated OER
Etc: Maps Etc: Mean Average Temperatures in North America, 1906
A map from 1906 of North America showing the mean annual isotherms of the region given in degrees Fahrenheit. "The climate of North America naturally varies greatly, depending on latitude, the general atmospheric circulation or direction...
Curated OER
Educational Technology Clearinghouse: Maps Etc: South America, 1902
A map from 1902 of South America showing the national boundaries at the time. The map shows capitals, major cities, ports, railroads, canals, rivers, and coastal features. Railroads appear as red lines, with important trunk lines shown...
Curated OER
Educational Technology Clearinghouse: Maps Etc: South America (Physical), 1901
A map from 1901 of South America showing the physical features of the region. This map is color-coded to show general elevations from sea level to over 6,500 feet, mountain systems, drainage divides, lakes, rivers, coastal features, and...
Curated OER
Educational Technology Clearinghouse: Maps Etc: South America (Physical), 1868
A map from 1868 of South America showing the physical features of the region, vegetation types, ocean currents, temperatures, principal products and mineral deposits. Mountain chains are represented by lines of varying thickness, with...
Curated OER
Educational Technology Clearinghouse: Maps Etc: British Isles, 1902
A map of the British Isles in 1902, showing Ireland, Scotland, England, and Wales. The map shows cities, towns, and ports, primary and secondary railways, canals, heads of navigation on major rivers, isotherms of averaged annual...
Curated OER
Educational Technology Clearinghouse: Maps Etc: England and Wales: Climate, 1920
A climate map of England, Wales and southern Scotland from 1920, color-coded to show averaged annual rainfall ranging from 25 to over 80 inches, isotherms of mean January and July temperatures in degrees Fahrenheit, and the direction of...
Curated OER
Educational Technology Clearinghouse: Maps Etc: The United States, 1890
A map from 1890 of the United States showing physical features, and annual mean temperatures and rainfall. The map shows high mountains and lower ranges, watershed division boundaries, rivers, lakes, coastal features, and is color-coded...
Curated OER
Etc: Maps Etc: Climate and Watersheds of the United States, 1868
A map from 1868 of the United States showing physical features, mean annual temperatures, rainfall distribution, watersheds, and principal products in the area. The average annual temperatures are shown by isotherms, with temperatures...
University of Sydney (Australia)
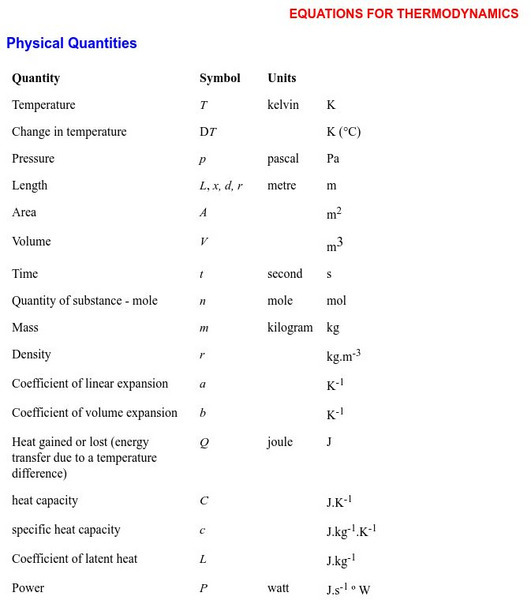
Equations for Thermodynamics
An exhaustive list of equations and formulas which are commonly used in thermal physics (including equations for triple point). Equations are organized according to category. Meaning of the symbols is clearly stated.
Other popular searches
- Isobars and Isotherms
- Isobar and Isotherm
- Isotherm and Isobar Maps
- Isotherm Maps
- Drawing Isotherms Lines
- Isotherms Weather Map
- Isotherm Worksheets
- Isotherm Lines
- Adiabatic Isothermal
- Isotherms Lines
- Isothermal Bars


