CK-12 Foundation
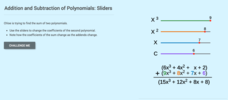
Addition and Subtraction of Polynomials: Sliders
Slide the coefficients to determine sums of polynomials. The interactive contains sliders to change the coefficients of an addend in a polynomial addition problem. Pupils determine the coefficients of the addend to arrive at particular...
CK-12 Foundation
Polynomials and Factoring: Classification Table
It all depends upon the terms. Pupils use the interactive table to sort polynomials. The scholars determine the names for the types of polynomials based on the number of terms.
CK-12 Foundation
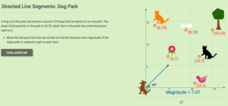
Directed Line Segments: Dog Park
Its a dog's world! Using a vector in standard position, pupils model the path a dog takes to different items in a dog park. The individuals use the interactive to find the magnitude and direction of the directed line segment.
CK-12 Foundation
Counting Events: Flipping Unfair Coins
Who said life was fair? An interactive uses an area diagram to represent the probabilities of flipping unfair coins. Pupils use the diagram to calculate the probabilities of outcomes of flipping the two coins. The scholars must decide...
CK-12 Foundation
Expected Value: Playing Darts
The expected payoff is right on target. An interactive resource provides a dart game scenario with amounts of cash prizes and probabilities of winning. Learners calculate the expected value and expected payoff for the game. To finish,...
CK-12 Foundation
Numerical Computations: Counting Out Probability
Keep your heads up while counting. Pupils use an interactive to create a table with the possible outcomes of flipping three coins and then determine the probabilities of getting certain combinations of heads and tails.
CK-12 Foundation
Conditional Probability: Colorful Cubes
An interactive provides a model to visually represent the formula for the probability of an outcome. Given 10 numbered color cubes, pupils arrange them on the top and bottom shelf to represent the probability fraction. The learners use...
CK-12 Foundation
Coterminal Angles: Full Circle
Take a terminal side for a spin. Pupils use an interactive to investigate angles of rotation that share the same terminal side. Scholars create coterminal angles and calculate what other angle sizes share the same final position.
CK-12 Foundation
Interpretation of Circle Graphs: Northwest Region Population Pie
Given populations of the five Northwestern states, learners create a circle graph. Using the data and the pie chart, they make comparisons between the populations of the states. Finally, the pupils determine how the chart will change...
CK-12 Foundation
Types of Data Representation: Baby Due Date Histogram
Histograms are likely to give birth to a variety of conclusions. Given the likelihood a woman is to give birth after a certain number of weeks, pupils create a histogram. The scholars use the histogram to analyze the data and answer...
CK-12 Foundation
Misleading Graphs (Identify Misleading Statistics): Are Virgos Cursed?
Is it safe to take data at its face value? Pupils use the interactive to evaluate a claim that Virgos are more likely to get into a car crash than others. Individuals determine whether another variable may be at play.
CK-12 Foundation
Multiple Bar Graphs
I scream, you scream, we all scream for ice cream bar graphs. Pupils create a multiple bar chart to represent the sales of ice cream products during the first week of summer. Using the chart, learners find the day that each of the...
CK-12 Foundation
Understand and Create Histograms: Car Sales
Create a history of car sales. Pupils create a histogram/bar graph to show the number of car sales made during the week. Using the data display, learners calculate numerical summaries of the data and find the percent of cars sold during...
CK-12 Foundation
Frequency Polygons: Constructing a Frequency Polygon
Connect the dots on frequency. Given a distribution table of scores on an assessment, learners create a frequency polygon by moving points on a graph to the correct frequency. The pupils use the display to answer questions about the...
CK-12 Foundation
Mode: Kittens
It is not as difficult as herding cats. The short interactive provides a group of kittens to sort according to their colors. Pupils determine the mode of the number of kittens by color. The questions continue with other numbers of...
CK-12 Foundation
Mode: Mucho Money
Generate stacks of money. Given bills of different denominations, pupils stack them based on their values. The learners figure out which value is the mode of the data and determine whether the data is unimodal, bimodal, or multimodal.
CK-12 Foundation
Mean: Harmonic Mean
Let the means live in harmony. With lengths representing the values of a small data set, learners compare the arithmetic mean to the harmonic mean. The pupils determine which value is the most accurate representation of the average of...
CK-12 Foundation
Absolute Extrema and Optimization: Building the Biggest Box
Optimally, you want the largest box. Given a square piece of box material, pupils determine the size of congruent squares to cut out of the corners to create a box with the greatest volume. Learners determine the equation of the volume...
CK-12 Foundation
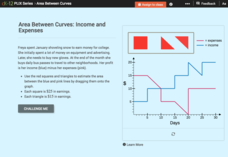
Area Between Curves: Income and Expenses
Use the area of polygons to calculate the area between curves. Pupils calculate areas under income and expense curves by filling the space with squares and right triangles. Using that information, they determine the profit related to the...
CK-12 Foundation
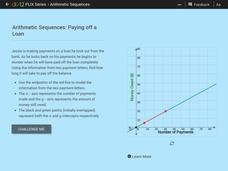
Arithmetic Sequences: Paying of a Loan
How long does it take to pay off a loan? Pupils use a graph to model the sequence associated with paying off a loan. Using the graph, learners determine the initial value and the common difference of the arithmetic sequence. The learners...
CK-12 Foundation
Volume by Cross Section: Volume of the Cone
Discover another way to find the volume of a cone. Pupils explore how the area of a cross section changes as it moves through a cone. The interactive uses that knowledge to develop the integral to use to find the volume of the cone....
CK-12 Foundation
Arithmetic Series Sums: Adding Arithmetic Sums
Sum up the shortcuts. The interactive allows pupils to discover a shortcut in finding a partial sum of an arithmetic series. Learners use the shortcut to find other sums and to verify the process.
CK-12 Foundation
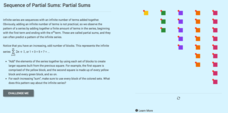
Sequence of Partial Sums: Partial Sums
Have some fun building squares out of triangles. Pupils investigate the partial sums of odd numbers. Using the sum of the first four odd numbers, learners see that it can be rewritten as a sum containing a triangular number. Simplifying...
CK-12 Foundation
Sums of Geometric Series
Geometric series either get bigger or approach a single number. So, how do you know which it is? An interactive presents three different geometric series with varying common ratios. With the aid of patterns, pupils determine values of r...


