EngageNY
Writing Addition and Subtraction Expressions
Symbols make everything so much more concise. Young mathematicians learn to write addition and subtraction expressions — including those involving variables — from verbal phrases. Bar models help them understand the concept.
EngageNY
Equivalent Ratios
Equivalent ratios show up on tape. Young mathematicians use tape diagrams to create equivalent ratios in the initial lesson plan on the topic. They learn the definition of equivalent ratios and use it to build others in the third segment...
EngageNY
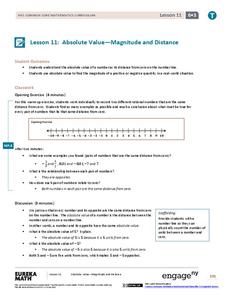
Absolute Value—Magnitude and Distance
Do you want to use the resource? Absolutely. Scholars learn about absolute value and its relation to magnitude and distance on a number line. They compare numbers in context by applying absolute value.
EngageNY
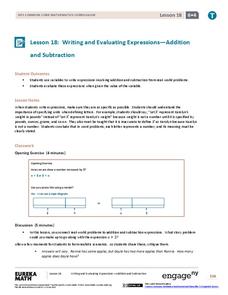
Writing and Evaluating Expressions—Addition and Subtraction
Let Y represent Yes to using an excellent resource. Pupils first learn to define variables using a complete description in the 19th part in a series of 36. They write expressions involving addition and subtraction in real-world...
Curated OER
Carnival Tickets
A great subtraction and division discovery opportunity for young mathematicians, this learning task involves seven word problems that require multiple steps. Learners use a math table to persevere in solving problems that are...
Curated OER
Information at a Glance - Using Tables in Mathematics
Students create table to display GED Testing data located in paragraph provided by teacher, use information in table to create appropriate graph, and determine percentage difference between passing scores and failing scores.
Curated OER
Math Handbook: Trigonometry
You'll be spinning in unit circles once you read through this jumbo-sized resource of everything you need to know about trigonometry. Each page has color-coded examples with explicit directions that detail the problems and...
Curated OER
Comparing Costs
Students compare the costs of two cellular phone plans and determine the best rate. They use a table and a graph of points plotted on a Cartesian plane to display their findings. Students write an equation containing variables that could...
Curated OER
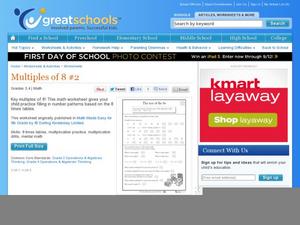
Multiples of 8 #2
How quickly can your third graders recite their eight times table? Help them with their mental math by focusing on multiplying by eight. After completing six number sequences, pupils solve word problems and multiplication sentences. A...
Curated OER
The Rest of the 7s
Help your fourth graders master the 7 times table. They complete number sequences and solve multiplication problems in numerical and written formats. Once they finish this activity, they'll be ready to take on 8s and 9s!
Teach Engineering
Understanding Elements
Nothing says organization quite like a table. The third lesson in a six-part Mixtures and Solutions unit teaches young scientists about elements and the periodic table. They learn how the periodic table is organized and about the...
Project Maths
Introduction to Patterns
The world is full of patterns. Help learners quantify those patterns with mathematical representations. The first Algebra lesson in a compilation of four uses a series of activities to build the concept of patterns using multiple...
02 x 02 Worksheets
Inverse Variation
Discover an inverse variation pattern. A simple lesson plan design allows learners to explore a nonlinear pattern. Scholars analyze a distance, speed, and time relationship through tables and graphs. Eventually, they write an equation to...
Curated OER
Food chains at sea
Fifth graders interpret a table of data about food chains in the ocean. They create a food chain to represent the information on the table. Periwinkles eat seaweed, and crabs eat periwinkles - so who eats crabs? Extend the activity with...
Illustrative Mathematics
Walk-a-thon 1
Your mathematician's job is to explore the relationship between hours and miles walked during a walk-a-thon. The activity compels your learners to experiment with different means in finding out this proportional relationship. The answer...
Mathematics Vision Project
Module 9: Modeling Data
How many different ways can you model data? Scholars learn several in the final module in a series of nine. Learners model data with dot plots, box plots, histograms, and scatter plots. They also analyze the data based on the data...
Mathematics Vision Project
Module 8: Modeling With Functions
Sometimes there just isn't a parent function that fits the situation. Help scholars learn to combine function types through operations and compositions. Learners first explore a new concept with an introductory activity and then follow...
Curated OER
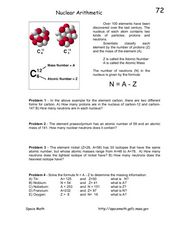
Nuclear Arithmetic
In "Nuclear Arthmetic," first-time physical scientists examine atomic structure and the periodic table of elements. The are given the formula, "N = A-Z," in which N is the number of neutrons, A is the atomic mass, and Z is the atomic...
Curated OER
Practice the 9s
How fast can you finish? Scholars who have already learned multiples of nine get some timed practice as they finish this 60-problem set. They multiply nine by numbers 0-10 with a goal of both speed and accuracy. Two minutes would be an...
Education Development Center
Language of Algebra
Don't rush into algebra, let learners visualize, guess, and predict their way to a successful math career. The introductory unit incorporates beginner algebraic concepts with shapes instead of variables. Young mathematicians use a...
Mathematics Vision Project
Module 8: Probability
It's probably a good idea to use the unit. Young mathematicians learn about conditional probability using Venn diagrams, tree diagrams, and two-way tables. They also take into consideration independence and the addition rules.
Alabama Learning Exchange
Ice Fishing is for the Birds
Approach addition with young mathematicians in an engaging way through this penguin-inspired activity. In small groups, scholars think about times they have used addition in their real lives (there are some suggestions given), then watch...
CK-12 Foundation
Understand and Create Histograms: Histograms
Tally ho! Represent the frequency of ages at school. Pupils finish a tally chart to match the frequencies of ages at school. Using the frequencies, the learners create a histogram. With the aid of the histogram and the frequency table,...
CK-12 Foundation
Frequency Polygons: Constructing a Frequency Polygon
Connect the dots on frequency. Given a distribution table of scores on an assessment, learners create a frequency polygon by moving points on a graph to the correct frequency. The pupils use the display to answer questions about the...


