CK-12 Foundation
Slope-Intercept Form of Linear Equations: Cable Car Tracks
Get on track to learn about slope-intercept form. Scholars use an interactive to position a line along the tracks of cable car. Applying knowledge of slope and intercepts, they write the slope-intercept form of the equation for the line.
CK-12 Foundation
Measurement of Probability
Stockings make your legs warmer and math more enjoyable. A drag-and-drop interactive has pupils take stockings out of drawers to calculate probabilities. This includes dependent events where the probabilities depend on previous stocking...
CK-12 Foundation
Applications of Probability: What Are the Odds?
Improve your chances of understanding odds. Scholars use an interactive spinner to increase and decrease the number of favorable and unfavorable sections on the spinner. This spinner helps them learn about odds.
CK-12 Foundation
Slope: A-Frame House
This resource on learning about slopes from A-frames is A-okay. A simple interactive has learners adjust the height and width of an A-frame house, and then calculate the slope of the roof for each situation.
CK-12 Foundation
Equations of Perpendicular Lines
Investigate how the equation y = -1/x relates to perpendicular lines. Pupils align an arrow using an interactive so it is perpendicular to a bow string. A set of challenge questions helps learners discover slopes of perpendicular lines...
CK-12 Foundation
Homeostasis
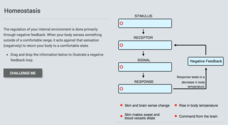
How much negative feedback does a body get daily? The interactive walks through one negative feedback loop, increasing body temperature. Then it challenges scholars to relate this to mechanical feedback loops and disorders that prevent...
CK-12 Foundation
Distance Between Two Points: Biking the Blocks
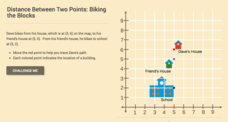
Distance estimates would be easy if the world were a grid. Scholars work to determine the distance between two structures using a coordinate plane. As an introduction, the lesson focuses on vertical and horizontal distances.
CK-12 Foundation
Basic Geometric Definitions: Alternate Dimensions
How do you calculate problems in alternate dimensions? The interactive allows learners to manipulate points in 2-D as scholars explore the relationship the points must have to create a one-dimensional object. Pupils identify objects that...
CK-12 Foundation
Angle Classification: Angle Exploration
Acute or obtuse? Seems right to me! As scholars explore the simulation, they investigate angle measures. Questions ask them to classify the angles using correct naming conventions.
CK-12 Foundation
Graphs of Functions Based on Rules: Plotting Profits
Profit from this interactive on graphing and interpreting functions. An interactive allows learners to plot a square root function representing a company's profits. They answer some challenge questions that require interpreting this...
CK-12 Foundation
Linear Inequalities: Concert Tickets
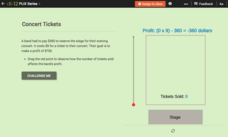
Profit from this resource on linear inequalities. A slider interactive lets users see how the profit on band ticket sales changes with the number of tickets. A set of challenge questions provides some situations for learners to consider.
CK-12 Foundation
One-Step Equations Transformed by Multiplication/Division: Dividing Plums
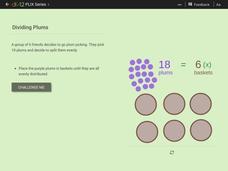
Be sure to use this plum resource. Scholars apply an interactive to find the number of plums each friend receives after plum-picking. They see how the interactive relates to one-step equations.
CK-12 Foundation
Number Patterns: Square Sizes
Size up an interactive on square sizes. Scholars adjust the side length of a square to represent the next term in a geometric pattern. They answer a set of challenge questions on the pattern to complete the activity.
CK-12 Foundation
Input-Output Tables for Function Rules
How does changing a graph affect the function? Learners watch the changing input-output table as they adjust the location of the line graph. Questions prompt them to complete a table of values and determine the function rule.
CK-12 Foundation
Parallel and Skew Lines: Parallel or Not?
There's nothing askew about an informative resource. Pupils adjust one of two lines in an interactive to determine if the lines are parallel or skew. They answer a set of challenge questions about the lines.
CK-12 Foundation
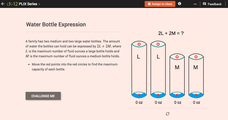
Evaluate Expressions with One or More Variables: Water Bottle Expression
Fill your mind as you fill virtual water bottles. Pupils use an interactive to find the amount of water that can fit in given containers. Writing and evaluating an algebraic expression helps with this task.
CK-12 Foundation
Checking Solutions to Inequalities: Apples and Bananas Shopping Excursion
Go bananas over a fun interactive! Learners drag a point on a virtual graph of an inequality to see if it is a solution. This helps determine the possible numbers of apples and bananas a shopper can buy with a given amount of money.
CK-12 Foundation
Seasons: Shadow Lengths
Before iPhones and calendars, how did humans determine the seasons of the year? Middle school scientists discover how to use shadows to determine the time of year in an enlightening interactive. Pupils manipulate the sun and examine the...
CK-12 Foundation
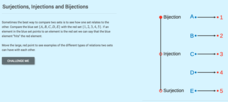
The Real Numbers: Surjections, Injections and Bijections
Inject a great interactive into your lesson plans. Scholars learn about injections, surjections, and bijections of sets. They use an interactive that shows an example for each of these relationships between sets.
CK-12 Foundation
Bar Graphs, Frequency Tables, and Histograms: Comparing Heights
Become a master at creating visual displays. Using a provided list of heights, users of the interactive create a bar graph and a histogram. They answer a set of challenge questions based on these data representations.
CK-12 Foundation
Graphs for Discrete and for Continuous Data: Discrete vs. Continuous Data
Not all data is the same. Using the interactive, pupils compare data represented in two different ways. The learners develop an understanding of the difference between discrete and continuous data and the different ways to represent each...
CK-12 Foundation
Interpretation of Circle Graphs: Northwest Region Population Pie
Given populations of the five Northwestern states, learners create a circle graph. Using the data and the pie chart, they make comparisons between the populations of the states. Finally, the pupils determine how the chart will change...
CK-12 Foundation
Types of Data Representation: Baby Due Date Histogram
Histograms are likely to give birth to a variety of conclusions. Given the likelihood a woman is to give birth after a certain number of weeks, pupils create a histogram. The scholars use the histogram to analyze the data and answer...
CK-12 Foundation
Misleading Graphs (Identify Misleading Statistics): Are Virgos Cursed?
Is it safe to take data at its face value? Pupils use the interactive to evaluate a claim that Virgos are more likely to get into a car crash than others. Individuals determine whether another variable may be at play.


