CK-12 Foundation
Ck 12: Algebra: Linear Interpolation and Extrapolation
[Free Registration/Login may be required to access all resource tools.] Use linear interpolation, linear extrapolation, and the line of best fit to make predictions about a data set.
Texas Instruments
Texas Instruments: Linear Functions Modeled by Data
Students submit their own data that can be modeled by a linear function. Students find the line of best fit, and discuss graphs of linear functions.
Texas Instruments
Texas Instruments: Boat Registration and Manatee Deaths in Florida
Students will explore the data on boat registrations and manatee deaths in Florida. They will use the data, the graph of the data and the line of best fit to make predictions about the relationship of the data.
Illustrative Mathematics
Illustrative Mathematics: 8.sp Animal Brains
This task looks at a possible relationship between the weight of an animal's body and the weight of its brain. Students make a scatter plot of data, look for outliers, make a second scatter plot without the outliers, and describe the...
Shodor Education Foundation
Shodor Interactivate: Multiple Linear Regression
Students compare multiple independent variables as predictors of one dependent variable. Students explore correlation and lines of best-fit.
Shodor Education Foundation
Shodor Interactivate: Linear Regression and Correlation
Learners are introduced to correlation between two variables and the line of best fit.
Math Graphs
Houghton Mifflin: Math Graphs: Line of Best Fit 17 [Pdf]
Students calculate a linear regression model using a graphing calculator. The given points are available in PDF format.
Math Graphs
Houghton Mifflin: Math Graphs: Line of Best Fit 18 [Pdf]
Students calculate a linear regression model using a graphing calculator. The given points are available in PDF format.
Texas Instruments
Texas Instruments: Learning to Do Linear Regressions
This activity compares children's age to height to teach linear regressions. The handout includes notes for students and teachers with a step-by-step lesson on how to do three types of linear regressions - Best Fit line, Median Line and...
Other
Honolulu Community College: Galileo's Kinematics
In this experiment you will attempt to reproduce Galileo's results using the inclined plane. You will test three hypotheses relating to motion on an incline. You will learn to draw a "best fit" or regression line of experimental data....
Texas Education Agency
Texas Gateway: Modeling Data With Linear Functions
Given a scatterplot where a linear function is the best fit, the student will interpret the slope and intercepts, determine an equation using two data points, identify the conditions under which the function is valid, and use the linear...
Other
Linear Functions, Slope and Regressions
Find activities here for linear functions, slopes and regression lines. Use them for classroom work or individual assignments.
CK-12 Foundation
Ck 12: Scatter Plots and Linear Correlation
[Free Registration/Login may be required to access all resource tools.] This lesson covers plotting a scatterplot and finding a linear equation that best fits the data.
University of South Florida
Florida Center for Instructional Tech: Walking the Plank
Students use weight to collect data and investigate the linear relationship. This activity uses a graphing calculator.
Varsity Tutors
Varsity Tutors: Hotmath: Practice Problems: Fitting Equations to Data
Five problems present practice using data to write equations and linear models. They are given with each step to the solution cleverly revealed one at a time. You can work each step of the problem then click the "View Solution" button to...
Texas Instruments
Texas Instruments: That's a Stretch Ti 83
Students determine the relationship between the stretch of a spring and the number of weights in a cup suspended from the spring. They find the Y-value of a function if the X-value is provided. They use technology to plot a set of...
Texas Instruments
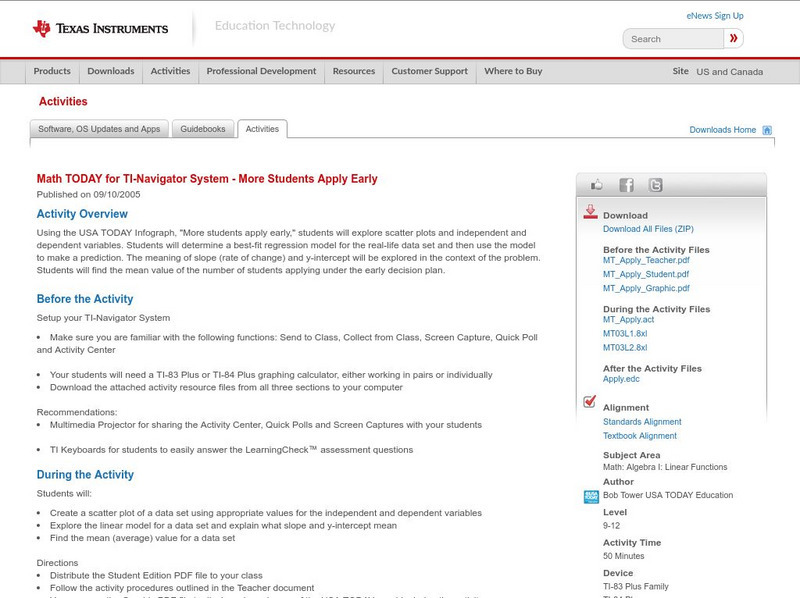
Texas Instruments: Math Today for Ti Navigator System: More Students Apply Early
Using the USA TODAY Infograph, "More students apply early," students will explore scatter plots and independent and dependent variables. Students will determine a best-fit regression model for the real-life data set and then use the...
Texas Instruments
Texas Instruments: Influence and Outliers
In this activity, students will identify outliers that are influential with respect to the least-squares regression line. Students will describe the role of the location of a point relative to the other data in determining whether that...
Sophia Learning
Sophia: Using Lines of Fit for Estimations
This lesson explains that lines of fit are estimations and may differ.
Texas Education Agency
Texas Gateway: Collecting Data and Making Predictions
Given an experimental situation, the student will write linear functions that provide a reasonable fit to data to estimate the solutions and make predictions.
Texas Instruments
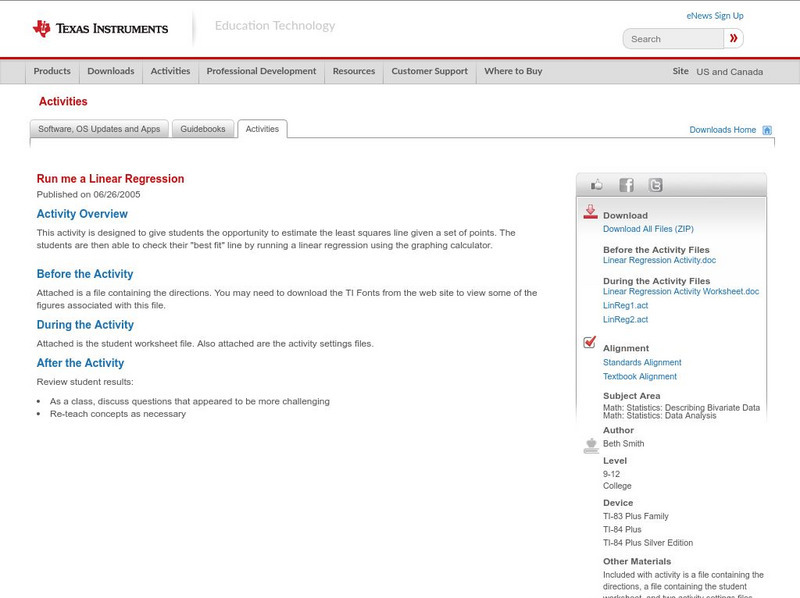
Texas Instruments: Run Me a Linear Regression
This activity is designed to give students the opportunity to estimate the least squares line given a set of points. The students are then able to check their "best fit" line by running a linear regression using the graphing calculator.
Math Is Fun
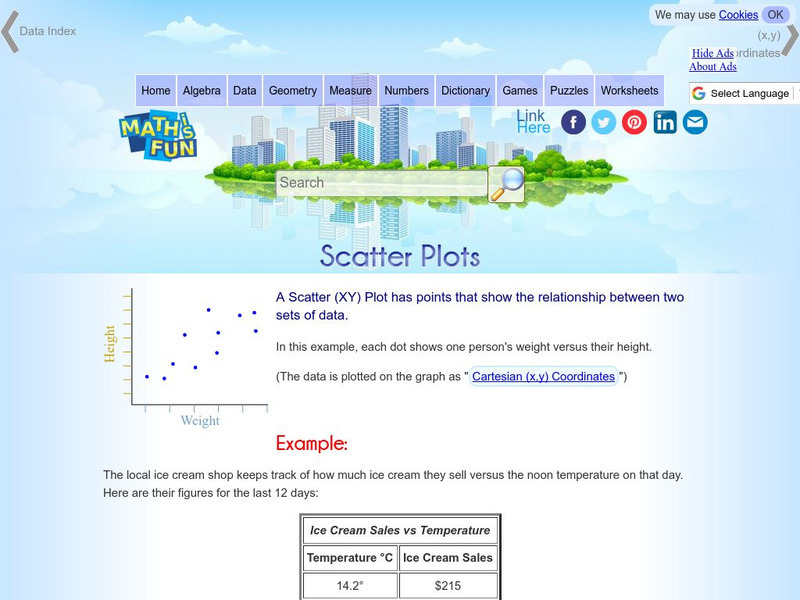
Math Is Fun: Scatter Plots
Explains, with examples, what scatter plots are and how to interpret the data. Discusses trends, interpolation and extrapolation, and correlation. Includes a set of practice questions.
Texas Instruments
Texas Instruments: Burning Volumes
An analysis of how the volume of various jars impacts the burning time of candles. Data collected will be used to explore modeling, line fitting and linear regression Using graphing calculators.
National Council of Teachers of Mathematics
Nctm: Illuminations: Linear Regression 1
An interactive program where students will explore regression lines. Students will be introduced to the correlation coefficient and come to understand what it represents through the given exploration. Requires Java.
Other popular searches
- Best Fit Line
- Best Fitting Line
- Math Best Fit Line
- Algebra Line of Best Fit
- Best Fit Line Worksheets
- Best Line of Fit


