NASA
Benford's Law
In this Benford's Law learning exercise, high schoolers read about the first digit frequency of numbers. Students solve 3 problems about sunspot numbers, solar wind magnetism and the depth of the latest earthquakes by using on line sites...
Curated OER
Snow Cover by Latitude
Students create graphs showing the amount of snow coverage at various points of latitude and compare graphs.
Illustrative Mathematics
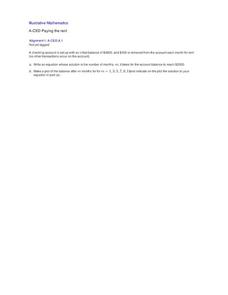
Paying the Rent
Learning how a bank account works is a useful tool. The exercise in the resource is to deduct rent from a checking account and create an equation from a description. Participants then graph the balance of the bank account versus months...
Houghton Mifflin Harcourt
Unit 3 Math Vocabulary Cards (Grade 3)
Looking for math vocabulary cards for third graders? Use a set of 15 math cards with terms associated with graphing. The top half of each sheet has the vocabulary word printed in bold text, and the bottom half includes...
101 Questions
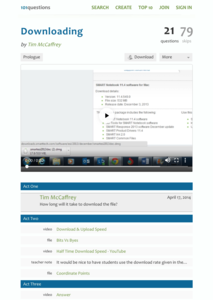
Downloading
Have you ever wanted to download a great lesson, but you weren't sure if you had enough time? Scholars learn to create a function for this situation to determine when a file will finish downloading. They also learn the difference between...
Curated OER
The Ups and Downs of don Pasquale: Mapping the Emotional Journey of Characters in Don Pasquale
Students listen to and retell the story of Don Pasquale. They evaluate the emotions of the main characters. Students create a graph of the emotions of Don Pasquale.
Curated OER
Shaky New Zealand
Students explore geography by answering study questions in class. In this plate tectonics lesson, students identify the earthquake data concerning the country of New Zealand and answer questions regarding the data. Students identify...
Curated OER
Linear Regression on TI-89
In this linear regression worksheet, students use the TI-89 calculator to graph linear regressions. Details instructions on the use of the calculator are provided. This one-page worksheet contains six problems.
Curated OER
Specific Heat and Insulation
Young scholars measure the air and soil temperatures at designated times. They graph the temperatures of each on one piece of graph paper with different colors. Students compare the information for the two line plots and analyze their...
Curated OER
Best Guesser
Fifth graders develop strategies for estimating ages, and illustrate results by graphing and interpreting scatter plots to compare x and y coordinates.
Curated OER
Graphing To Solve Systems of Equations
Students explore graping linear equations and their relevance to real life situations. After a teacher led demonstration, students work at their desks and on the board to plot points and determine the slope of a line. Students then...
Curated OER
Univariate Data Analysis
Students use given data to compare baseball players. They create box and whisker plots to compare the players and determine which they feel is the best player. Students use calculators to make box and whisker plots. They write paragraphs...
Curated OER
Snow Cover By Latitude
Students examine computerized data maps in order to create graphs of the amount of snowfall found at certain latitudes by date. Then they compare the graphs and the data they represent. Students present an analysis of the graphs.
Curated OER
Points, Regions, Distance and Midpoints
In this college level coordinate geometry worksheet, students identify and graph points on a coordinate plane, find the missing side of a right triangle, determine the distance between two points, and find the midpoint of a line...
Willow Tree
Midpoint and Distance Formulas
The shortest distance between two points is a straight line. Learners use the Pythagorean Theorem to develop a formula to find that distance. They then find the midpoint using an average formula.
NY Learns
Investigation - Looking at Polygons
Middle schoolers construct polygons by plotting points on a coordinate plane. Pupils connect the points and identify which polygons they have drawn. They will need graph paper to carry out the assigned activities. A vocabulary list,...
Curated OER
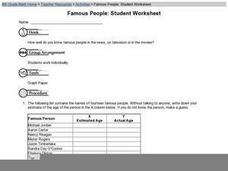
Famous People: Student Worksheet
Older learners consider a list of famous people, and they fill in two columns; one in which they guess the celebrities' ages, and another where they look up their actual age. They construct a graph by assigning one of the columns...
Curated OER
Real World Investigation- Math and Geography- Elevation Changes
In this math and geography real world investigation, 6th graders plan a driving trip to a city that is located several states away from their home while recording the elevations of three cities that are included in the trip. They use...
Primary Resources
Coordinate Pairs: An Introduction
Ordered pairs, the x and y-axis - sounds like it's time to introduce learners to the plotting points on a graph! This presentation is great as it introduces the concept, provides an example of how to use a coordinate plane, and then...
Curated OER
Coordinate Planes
Identifying the location of ordered pairs on coordinate planes is the focus in the math lesson presented here. In it, 4th graders are introduced to coordinate pairs, the x/y axis, and the techniques associated with this type of graphing....
Statistics Education Web
Sampling in Archaeology
Compare different random sampling types using an archaeological setting. Scholars collect data from an archaeological plot using simple random samples, stratified random samples, systematic random samples, and cluster random samples....
Curated OER
Connecting Algebra and Geometry Through Coordinates
This unit on connecting algebra and geometry covers a number of topics including worksheets on the distance formula, finding the perimeter and area of polynomials, the slope formula, parallel and perpendicular lines, parallelograms,...
Curated OER
Logarithmic Functions
Learners explore the characteristics of logarithmic functions and their relationship to exponential functions. Using the subscriber website Explorelearning.com, pupils observe changes in the input variable and its effect on the graph of...
Bytes Arithmetic
Geometry Pad+
Graphing paper, pencil, ruler, protractor, and compass, all get replaced or supplemented with this dynamic geometry application. Here, you can create, move, and scale many different shapes, as well as, explore and change their properties...


