Illustrative Mathematics
Illustrative Mathematics: F Le Identifying Functions
In this task, learners are shown a table with linear, quadratic, and exponential functions at various values of x and are asked to match the function type to each data set and explain their reasoning. Aligns with F-LE.A.1.b and F-LE.A.1.c.
Math Graphs
Houghton Mifflin: Math Graphs: Fitting Models to Scatter Plots 1 [Pdf]
Learners use a scatter plot to determine whether data can be modeled by a linear function, a quadratic function, a trigonometric function, or that there appears to be no relationship between x and y. The resource consists of an enlarged...
Math Graphs
Houghton Mifflin: Math Graphs: Fitting Models to Scatter Plots 2 [Pdf]
Students use a scatter plot to determine whether data can be modeled by a linear function, a quadratic function, a trigonometric function, or that there appears to be no relationship between x and y. The resource consists of an enlarged...
Math Graphs
Houghton Mifflin: Math Graphs: Fitting Models to Scatter Plots 3 [Pdf]
Students use a scatter plot to determine whether data can be modeled by a linear function, a quadratic function, a trigonometric function, or that there appears to be no relationship between x and y. The resource consists of an enlarged...
Math Graphs
Houghton Mifflin: Math Graphs: Fitting Models to Scatter Plots 4 [Pdf]
Students use a scatter plot to determine whether data can be modeled by a linear function, a quadratic function, a trigonometric function, or that there appears to be no relationship between x and y. The resource consists of an enlarged...
Richland Community College
Richland Community College: Math 116 Lecture Notes
This site from the Richland Community College provides the detailed lecture notes to a college algebra course, complete with equations and definitions. Content ranges from "functions and their graphs" to "conics and parametric equations."
Khan Academy
Khan Academy: Fitting Quadratic and Exponential Functions to Scatter Plots
Determine if a quadratic or exponential model fits a data set better, then use the model to make a prediction. Students receive immediate feedback and have the opportunity to try questions repeatedly, watch a video or receive hints.
Math Graphs
Houghton Mifflin: Math Graphs: Fitting Models to Scatter Plots 7 [Pdf]
Learners use a given scatter plot to identify whether the data can be modeled by a linear, quadratic, or trigonometric function. The math graph is available in PDF format.
Math Graphs
Houghton Mifflin: Math Graphs: Fitting Models to Scatter Plots 8 [Pdf]
Learners use a scatter plot to identify whether the data can be modeled by a linear, quadratic, or trigonometric function. The math graph is available in PDF format.
Illustrative Mathematics
Illustrative Mathematics: F Le Basketball Bounces, Assessment Variation 1
This task asks young scholars to analyze a set of data about the height of a basketball for each time it bounces. They choose a model that reasonably fits the data and use the model to answer questions about the physical context. This...
Illustrative Mathematics
Illustrative Mathematics: F Le Basketball Bounces, Assessment Variation 2
This task asks students to analyze a set of data about the height of a basketball for each time it bounces. They choose a model that reasonably fits the data and use the model to answer questions about the physical context. This second...
Illustrative Mathematics
Illustrative Mathematics: F Le Choosing an Appropriate Growth Model
The goal of this task is to examine some population data for large cities from a modeling perspective. Young scholars are asked to decide if the population data can be accurately modeled by a linear, quadratic, and/or exponential...
Khan Academy
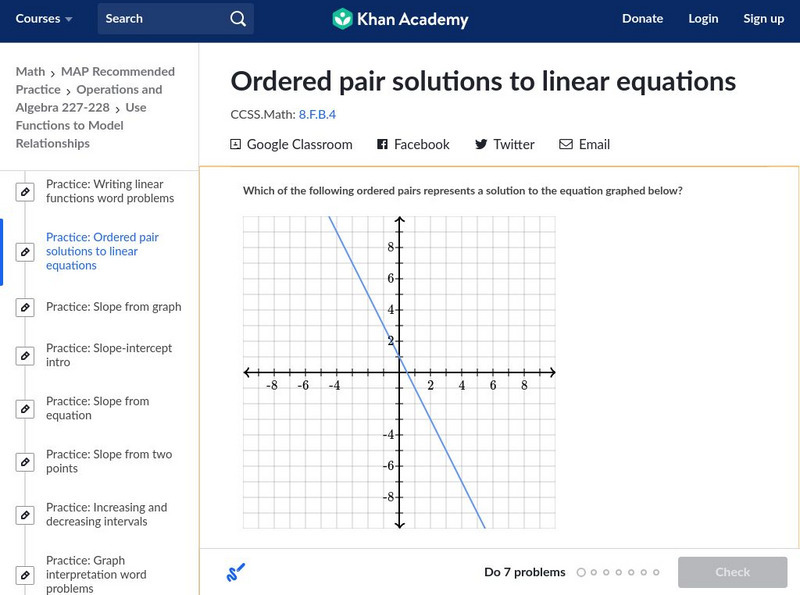
Khan Academy: Ordered Pair Solutions to Linear Equations
Determine which ordered pair represents a solution to a graph or equation. Students receive immediate feedback and have the opportunity to try questions repeatedly, watch a video or receive hints.
Khan Academy
Khan Academy: Equations & Inequalities Word Problems
HSA-CED.A.1: Interactive resource which create equations and inequalities in one variable and use them to solve problems. Include equations arising from linear and quadratic functions, and simple rational and exponential functions....
Math Graphs
Houghton Mifflin: Math Graphs: Fitting Models to Scatter Plots 5 [Pdf]
Learners evaluate a scatter plot to determine the relationship between two variables. The scatter plot is available in PDF format.
Math Graphs
Houghton Mifflin: Math Graphs: Fitting Models to Scatter Plots 6 [Pdf]
Learners evaluate a scatter plot to determine the relationship between two variables. The scatter plot is available in PDF format.
Khan Academy
Khan: Lsn 8: Interpreting Relationships in Scatterplots/graphs/tables/equations
This lesson focuses on Interpreting and analyzing linear, quadratic, and exponential models and graphs. Students will use best fit lines to interpret contexts, distinguish whether contexts are linear or exponential functions, use the...
PBS
Pbs: Black Kingdoms of the Nile
A geometry lesson that examines the history and structure of ancient pyramids and engages students in constructing pyramid models. A comprehensive lesson that considers students with diverse learning styles. Math concepts introduced...


![Houghton Mifflin: Math Graphs: Fitting Models to Scatter Plots 1 [Pdf] Unknown Type Houghton Mifflin: Math Graphs: Fitting Models to Scatter Plots 1 [Pdf] Unknown Type](https://d15y2dacu3jp90.cloudfront.net/images/attachment_defaults/resource/large/FPO-knovation.png)


