Curated OER
Introduction to Graphical Representation of Data Sets in Connection to Cellular Growth
Students practice graphing relationships between variables by studying topics such as exponential growth and decay. They conduct a series of numerical experiments using a computer model and a variety of physical experiments using mold,...
Virginia Department of Education
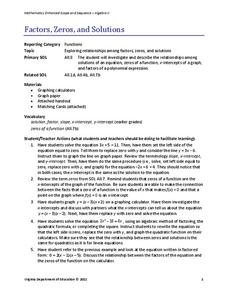
Factors, Zeros, and Solutions
Factors, zeros, and solutions, oh my! Don't let your classes become overwhelmed with the vocabulary. An engaging lesson helps learners make a connection between factors, zeros, and solutions. Pupils explore the relationship between the...
Curated OER
Solution Sets
Here is a task that gives the graph of the solutions of a system of linear inequalities and asks learners to analyze and write the algebraic form of the systems. By turning the problem around, learners make the connections between...
Curated OER
James and the Giant Peach Plot Analysis
It's all about the plot, main events, and story mapping with this lesson. As the class reads the novel James and the Giant Peach, they create an excitement graph that actually charts key events and moments of excitement. After...
EngageNY
Analyzing Residuals (Part 1)
Just how far off is the least squares line? Using a graphing calculator, individuals or pairs create residual plots in order to determine how well a best fit line models data. Three examples walk through the calculator procedure of...
Noyce Foundation
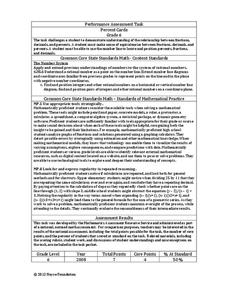
Percent Cards
Explore different representations of numbers. Scholars convert between fractions, decimals, and percents, and then use these conversions to plot the values on a horizontal number line.
PBL Pathways
College Costs
Predict the year that college costs will double in your state using linear modeling. The first part of this two-part project based learning activity asks young mathematicians to use data from the College Board. They graph the data,...
Illustrative Mathematics
Sports Equipment Set
Many students like to play sports and the equipment that goes with it costs money. The resource sets up an inequality that gives a total amount needed to purchase the equipment and the initial amount of money already obtained. In order...
Willow Tree
Midpoint and Distance Formulas
The shortest distance between two points is a straight line. Learners use the Pythagorean Theorem to develop a formula to find that distance. They then find the midpoint using an average formula.
Curriculum Corner
7th Grade Math Common Core Checklist
With so many math standards to fit into a school year, it can be difficult keeping track of what you have and have not covered. This collection of Common Core checklists allows you to maintain a running record of when each...
Curated OER
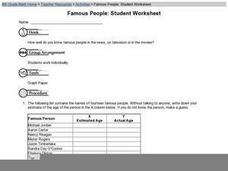
Famous People: Student Worksheet
Older learners consider a list of famous people, and they fill in two columns; one in which they guess the celebrities' ages, and another where they look up their actual age. They construct a graph by assigning one of the columns...
Curated OER
Coordinate Planes
Identifying the location of ordered pairs on coordinate planes is the focus in the math lesson presented here. In it, 4th graders are introduced to coordinate pairs, the x/y axis, and the techniques associated with this type of graphing....
Curated OER
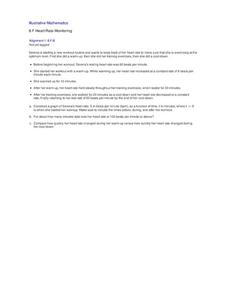
Heart Rate Monitoring
Algebra learners like this resource because it is easy to understand and it relates to their lives. Whether you are starting a new workout routine, or just climbing the stairs, your heart rate increases and decreases throughout the day....
5280 Math
Capture the Points
Play a game of capture the points. Young scholars receive a number line with specific points graphed and must write an inequality that captures all the points. The second task of the algebra project is to write an inequality with...
Curated OER
Algebra 1: Slope as Rate
Young scholars solve problems with slopes. In this algebra instructional activity, students identify the slope of a line and relate it to the rate of change. They graph their lines on the TI and observe changes in the lines.
Virginia Department of Education
Box-and-Whisker Plots
The teacher demonstrates how to use a graphing calculator to create box-and-whisker plots and identify critical points. Small groups then create their own plots and analyze them and finish by comparing different sets of data using box...
Curated OER
Logarithmic Functions
Learners explore the characteristics of logarithmic functions and their relationship to exponential functions. Using the subscriber website Explorelearning.com, pupils observe changes in the input variable and its effect on the graph of...
Curated OER
Using Your Marbles - Volume Measurement and Reporting
Demonstrate how to measure the volume of liquids and solids immersed in liquid to your class. They observe a teacher-led demonstration, and in small groups construct a data table that demonstrates how many marbles were used and the...
Illustrative Mathematics
Half of a Recipe
Kids love to cook! What is a better place to learn mixed numbers than with a recipe? It is up to learners to decide how they want to divide this recipe in half. They may choose to model the mixed number and then divide the model by two....
Virginia Department of Education
Analyzing and Interpreting Statistics
Use measures of variance to compare and analyze data sets. Pupils match histograms of data sets to their respective statistical measures. They then use calculated statistics to further analyze groups of data and use the results to make...
Illustrative Mathematics
Distance across the channel
Here you will find a model of a linear relationship between two quantities, the water depth of a channel and the distance across the channel at water level. The cross section of the channel is the shape of an isosceles trapezoid. The...
Curated OER
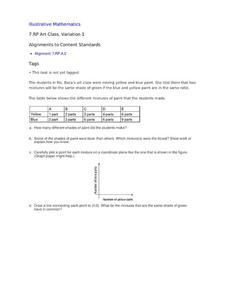
Art Class, Variation 1
Student statisticians calculate ratios to determine how many shades of green were mixed by Ms. Baca's art class. They graph the number of blue parts against the number of yellow parts for each combination and discover that some produce...
Georgia Department of Education
Math Class
Young analysts use real (provided) data from a class's test scores to practice using statistical tools. Not only do learners calculate measures of center and spread (including mean, median, deviation, and IQ range), but...
Curated OER
Sets, Relations, and Functions
Sets, relations, functions, and graphing linear equations are practiced in this challenging worksheet. The class determines if a relation is a function or not and find the functional value of a domain element. The one page worksheet...


