Education World
The African American Population in US History
How has the African American population changed over the years? Learners use charts, statistical data, and maps to see how populations in African American communities have changed since the 1860s. Activity modifications are included to...
Curated OER
Creating a Thematic Map
Students create and analyze a weather-related data table and a thematic map based upon information provided.
Wells Fargo
Wells Fargo History Museum: Curriculum Guide
Learn about the California Gold Rush from an institution that has been in place since the early days of the American West: Wells Fargo History Museum. From domain-specific vocabulary review to group research projects, an expansive packet...
Curated OER
Map Your School
Learners participate in a project to map their school. They measure and graph various areas around the school. Students find the longitude and latitude of the school and research the school's history, and highlight special important areas.
NFL
Super Bowl: History and Anthology
The educational opportunities are overwhelming with this (almost) complete anthology and history of every Super Bowl since 1968. Excite your football enthusiasts with information that can be used to create cross-curricular activities in...
Curated OER
Great Lakes Homepage for Kids
Here are some outstanding lessons on the geology and history of the Great Lakes. These lessons are divided into Grade 4 -6, and Grade 7 - 8 activities. The activities all use the background information, maps, graphs, data, and Great...
Curated OER
Exploring History Through Photographs
A fascinating series of four lessons on how photography and society have evolved over time. These lessons bring in elements of art, math, social studies, and geography. Everyone gets to make maps, look at old photos, and take part in a...
National Research Center for Career and Technical Education
STEM: Lou-Vee Air Car
A comprehensive instructional activity on acceleration awaits your physicists and engineers! Two YouTube videos pique their interest, then sample F=ma problems are worked and graphed. The highlight of the instructional activity is the...
Curated OER
Many Colored Maps
For this map worksheet, 6th graders identify and complete 10 different problems that include various dimensional maps. First, they complete the table on the right by coloring the maps found on the bottom. Then, students determine the...
C-SPAN
2016 Electoral College Map
The electoral college can be confusing for citizens of any age. Clear up misconceptions with a handy printable map that details how many electoral votes are allotted to each state, as well as a history of modern elections, complete with...
Curated OER
Grid Frame Mapping
Young scholars map and describe small area of the schoolyard and discuss habitats.
Curated OER
Local History: Mapping My Spot
Students explore maps to discover historical information about their local area. In this mapping and history lesson, students use panoramic maps of their own town/city to interpret historical information. Students also place themselves...
National Research Center for Career and Technical Education
Hospitality and Tourism 1: Safety and Sanitation
Math and science come alive in this career-related lesson on sanitation. Along the way, learners explore bacterial growth rates using exponential notation and graphs. A link to a very brief, but vivid video shows just how quickly these...
Yummy Math
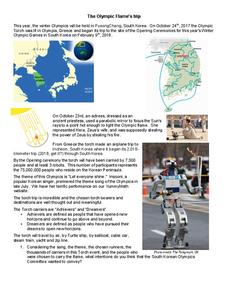
The Olympic Flame's Trip
Just in time for the start of the Winter 2018 Olympics, you can track the Olympic torch relay through the Republic of Korea. But there must be some math involved, right? Give learners a worksheet that prompts them to calculate the...
Curated OER
Whitewater Canal State Historic Site
If you happen to live in Indiana, or a neighboring state, and are planning a field trip to the Whitewater Canal State Historic Site, then this lesson plan will suit your needs quite well. In it, suggestions for activities before, during,...
Curated OER
Charts, Maps, and Graphs Lesson on the Holocaust
Students practice interpreting data. In this Holocaust lesson, students research selected Internet sources and examine charts, maps, and graphs regarding the Jewish populations in and out of Europe. Students respond to questions about...
Curated OER
Nazi Concentration Camps -- Map and Chart-Reading Activities
Learners use an informational chart about Nazi concentration and death camps to complete a mapping activity and a chart-reading activity.
National Research Center for Career and Technical Education
Information Technology: Photoshop Scale
Scaling is a practical skill as well as a topic to be addressed throughout the Common Core math standards. You are given three different presentations and a detailed teacher's guide to use while teaching proportion, as well as practice...
Teach Engineering
Who Can Make the Best Coordinate System?
Working with a map that does not have a coordinate system on it, small, collaborative teams must come up with a coordinate system for their map. Groups then explain their coordinate structure to the class.
Curated OER
Christopher Columbus: The Man, the Myth, the Legend
Learn more about maps by examining Christopher Columbus's voyage to the New World. Kindergartners will learn about basic map skills and how to identify the compass rose, oceans, and land masses. They will also discover the purpose of...
Curated OER
Middle Ages Cross Curriculum Project
Middle schoolers complete several projects on the Middle Ages. In this world history lesson, students complete language arts, social studies, math, and science projects. Some of these include: comparing a teenager's life now to that in...
Curated OER
The Notorious Four-Color Problem
Take a walk through time, 1852 to 2005, following the mathematical history, development, and solution of the Four-Color Theorem. Learners take on the role of cartographers to study a United States map that is to be colored. One rule: no...
National Research Center for Career and Technical Education
Hospitality and Tourism 2: Costing
The lesson plan provides a richly detailed narrative and sample problems for teaching or reinforcing how to work with percentages. In particular, your audience will compute the costs per serving of food and simulate setting menu prices...


