Curated OER
Graphs with Algebra and Geometry
In this math worksheet, students analyze graphs, the coordinate plane and angles. They identify polygons based on their number of sides and interior angles. There are 4 questions with an answer key.
Curated OER
Graph Linear Inequalities
In this algebra worksheet, students solve linear inequalities and graph their results on a coordinate plane. They shade the correct side of the line. There are 8 questions with an answer key.
Math Mammoth
Slope; Math Mammoth.com
For this math activity, students find the slope of four lines when they are drawn on a coordinate grid. Students are given the slope and draw the line for two lines. They use the slope formula to find slope when given two points on a...
Curated OER
Exploring Area/Perimeter Through Coordinate Geometry
Students explore area and perimeter through coordinate geometry using student literature, hands-on manipulatives, and the Internet.
Curated OER
Making an Alien Mask Using Coordinate Pairs
In this math learning exercise, students create an alien mask and practice graphing coordinate pairs. Students follow the directions to plot coordinates on an x and y axis. When they are finished students will see an alien face which can...
Curated OER
Graphing Systems of Inequalities
In this systems of inequalities worksheet, 11th graders solve and complete 8 different problems that include graphing. First, they graph each system of inequalities to determine the overlapping portion in each. Then, students draw a line...
Curated OER
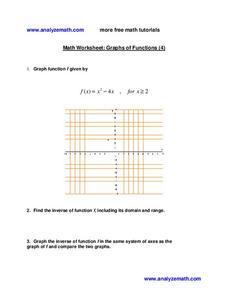
Graphs of Functions
In this graphs of functions worksheet, 9th graders solve and complete 3 different types of problems. First, they graph function f given by the functions shown on the grid. Then, students find the inverse of a function including its...
Curated OER
Plot the Coordinates
In this geometry skills instructional activity, students plot the listed coordinates on the provided graphs to create letters of the alphabet.
Curated OER
Graph Paper
Students are given pre-made graph paper. In this algebra instructional activity, students are given copies of graph paper that can be used to plot points on a coordinate plane already measured out.
Curated OER
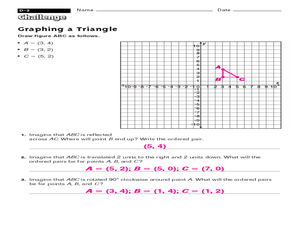
Graphing a Triangle
In this geometry skills worksheet, students graph a triangle using the provided information and then respond to 3 short answer questions regarding it.
Curated OER
Linking Number Patterns and Algebraic Expressions
Examine algebra using digital resources! Budding mathematicians will watch Cyberchase episode segments that propose a problem. Using information gathered from the video, they practice recording number patterns in several different ways:...
Curated OER
Slope Intercept Form
In this slope intercept form worksheet, students solve and graph 6 different problems that include identifying the slope and intercepts in each graph. First, they determine the line that has a given x-and y-intercept. Then, students find...
EngageNY
The Graph of a Function
Mathematics set notation can be represented through a computer program loop. Making the connection to a computer program loop helps pupils see the process that set notation describes. The activity allows for different types domain and...
Mathwire
Graph Each Ordered Pair - Five Worksheets
This resource is composed of five separate worksheets on ordered pairs. After plotting each ordered pair, learners label each point, connect the points to create a figure, identify the polygon type, find the perimeter and area of the...
EngageNY
Coordinates of Points in Space
Combine vectors and matrices to describe transformations in space. Class members create visual representations of the addition of ordered pairs to discover the resulting parallelogram. They also examine the graphical representation...
Kenan Fellows
Math Made Simple as 1-2-3: Simplified Educational Approach to Algebra
Writing an equation of a line is as easy as m and b. A lesson presentation gives individuals different strategies for writing equations of lines. Some items provide a slope and a point while others provide two points. Whatever the given,...
Schoolcraft College
Trigonometry
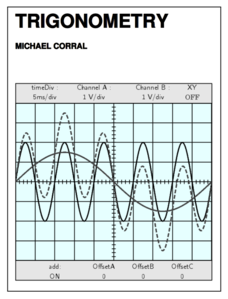
This trigonometry textbook takes the learner from a basic understanding of angles and triangles through the use of polar coordinates on the complex plane. Written by a mathematician-engineer, examples and problems here are used to...
CK-12 Foundation
Linear Inequalities in Two Variables
Take the tediousness out of finding solutions of inequalities by graphing. Individuals use an interactive that allows them to adjust a system of inequalities on a coordinate plane. Using the interactive helps find solutions to systems of...
CK-12 Foundation
Geometric Sequences: Bacteria Colony
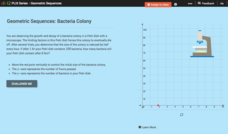
Show budding mathematicians how to model a diminishing bacteria colony two ways—graphically and algebraically. Using the coordinate axis, pupils create a graph to represent the decay of a bacteria colony. They determine the number of...
Radford University
How to Calculate and Analyze the Equation for a Parabolic Path
Working in groups, pupils plot three points on the coordinate plane representing three different parabolic paths. Using a calculator, they determine the quadratic regression equation for their models. Each team then figures out the...
Georgia Department of Education
Math Class
Young analysts use real (provided) data from a class's test scores to practice using statistical tools. Not only do learners calculate measures of center and spread (including mean, median, deviation, and IQ range), but...
Pearson
End of Year Practice Test (Grade 8 Math)
This is a great resource to keep daily material aligned to standardized assessments. It offers complete multiple choice and short-answer practice with a wealth of opportunities for customization. Offer it as a whole,...
Charleston School District
The Distance Between Points
Find the shortest distance from A to B using the Pythagorean Theorem! Scholars learn they can find the distance between two points by creating a right triangle using the horizontal and vertical lengths and applying the Pythagorean...


