EngageNY
Graphs of Simple Nonlinear Functions
Time to move on to nonlinear functions. Scholars create input/output tables and use these to graph simple nonlinear functions. They calculate rates of change to distinguish between linear and nonlinear functions.
Virginia Department of Education
Graphing Linear Equations
Combine linear equations and a little creativity to produce a work of art. Math scholars create a design as they graph a list of linear equations. Their project results in a stained glass window pattern that they color.
Curated OER
Reading Graphs
Encourage kids to read line graphs with confidence using these examples and accompanying comprehension questions. Learners examine two graphs and answer four questions about each. This is definitely intended for beginners to this type of...
Curated OER
Treasure Hunt: Coordinate Graphing
Two of the best words any one can hear– treasure hunt! Your class will be excited to practice graphing on a coordinate grraph as they identify and write coordinates for landmarks they see on a treasure map. They trace their route to the...
Marshall Cavendish International
Coordinate Plane Treasure Hunt
Similar to the game Battleship®, partners try and determine where the opponent buried their treasures on the hidden coordinate plane. Two types of planes are provided, one with only quadrant one and one with all four for a higher...
Mt. San Antonio Collage
Quadratic Functions and Their Graphs
Starting with the basics, learners discover the features of a parabola and the ways to accurately graph it. After pupils practice with graphing, the end of the learning exercise focuses on application type problems.
Curated OER
Coordinate Planes
Identifying the location of ordered pairs on coordinate planes is the focus in the math lesson presented here. In it, 4th graders are introduced to coordinate pairs, the x/y axis, and the techniques associated with this type of graphing....
Shodor Education Foundation
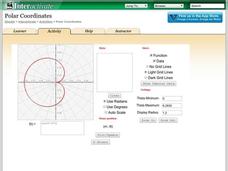
Polar Coordinates
Polar opposites might not work together—but polar coordinates do! The interactive provides learners the opportunity to graph trigonometric and algebraic functions using polar coordinates. The program takes either individual data points...
EngageNY
Perimeter and Area of Polygonal Regions in the Cartesian Plane
How many sides does that polygon have? Building directly from lesson number eight in this series, learners now find the area and perimeter of any polygon on the coordinate plane. They decompose the polygons into triangles and use Green's...
Mathed Up!
Coordinates
Young graphers decide where to plot a point given a specific ordered pair. The problems vary in difficulty, beginning with simpler coordinates, and ending with plotting and connecting coordinates. Each graph is labeled with the...
West Contra Costa Unified School District
Graphing Piecewise Functions
Step up to learn about step functions. The activity, designed for high schoolers, first covers piecewise functions and how to draw their graphs. It then introduces step functions, including the greatest integer (floor) and ceiling...
EngageNY
Perimeter and Area of Triangles in the Cartesian Plane
Pupils figure out how to be resourceful when tasked with finding the area of a triangle knowing nothing but its endpoints. Beginning by exploring and decomposing a triangle, learners find the perimeter and area of a triangle. They then...
EngageNY
Exploring the Symmetry in Graphs of Quadratic Functions
Math is all about finding solutions and connections you didn't expect! Young mathematicians often first discover nonlinear patterns when graphing quadratic functions. The lesson begins with the vocabulary of a quadratic graph and uses...
EngageNY
Graphing the Logarithmic Function
Teach collaboration and communication skills in addition to graphing logarithmic functions. Scholars in different groups graph different logarithmic functions by hand using provided coordinate points. These graphs provide the basis for...
EngageNY
Two Graphing Stories
Can you graph your story? Keep your classes interested by challenging them to graph a scenario and interpret the meaning of an intersection. Be sure they paty attention to the detail of a graph, including intercepts, slope,...
EngageNY
Graphing the Sine and Cosine Functions
Doing is more effective than watching. Learners use spaghetti to discover the relationship between the unit circle and the graph of the sine and cosine functions. As they measure lengths on the unit circle and transfer them to a...
Shodor Education Foundation
Graph Sketcher
Sketch graphs with the Graph Sketcher. Scholars graph functions on a coordinate plane. An interactive makes it as easy as inputting the function and clicking a button.
Curated OER
Four Quadrant Grid
Use this math worksheet to have your charges engage in positive and negative numbers for math coordinate graphing purposes. There are no questions on the page which is labeled for grade 5.
Pace University
Grades 9-10 Algebra: Graphic Quadratics on the Coordinate Plane
Find quadratics in the world. Learners select ways to compare and contrast linear and quadratic functions and how to demonstrate knowledge of parabolas in the world. Teachers assign a third task challenging individuals to find equations...
K-5 Math Teaching Resources
Graph Paper
You'll never have to buy graph paper again with this printable resource, which can be used for anything from creating graphs, plotting points in the coordinate plane, or measuring the area and perimeter of polygons. A helpful resource...
CK-12 Foundation
Polygon Classification in the Coordinate Plane
Classify this resource into the "Use" pile. Scholars use an interactive coordinate plane to plot polygons given coordinates for the vertices. They use properties to classify each polygon and answer a few challenge questions regarding the...
EngageNY
Graphing Rational Functions
Put everything together in a picture. Scholars take what they learned in the previous three lessons in the 15th segment of a 23-part unit to graph rational functions. They find the end behavior, the horizontal and vertical asymptotes if...
CCSS Math Activities
Smarter Balanced Sample Items: 7th Grade Math – Target E
How well do your classes understand scale? You'll certainly know after they answer the set of eight questions from an informative and helpful presentation. Questions include items from coordinate geometry, similar triangles, and scale...
Curated OER
Twenty-Seven Graphing Lines, Parabolas, and Absolute Value Problems
Have learners find coordinates of point on a graph, find equations of graphs given, and graph given equations using in and out tables. There are 27 problems related to equations for lines, parabolas, and absolute value functions.


